Knowledge Center Technical Analysis
Moving Averages
Simple Moving Average
Overview
A Simple Moving Average (SMA) is a widely used technical analysis tool in the stock market. It calculates the average of a security's closing prices over a specified time period, providing a smoothed trend line. Traders use SMAs to identify trends, potential reversal points, and to filter out short-term fluctuations, aiding in decision-making for buying or selling stocks. Shorter SMAs react quickly to price changes, while longer SMAs offer a broader view of the overall trend. Analyzing crossovers between different SMAs can signal potential changes in market direction.
A Simple Moving Average (Or SMA) Is Also Known as Arithmetic Moving Average.
Simple Moving Average Trading Strategy
A Simple Moving Average (SMA) trading strategy involves using moving averages to make informed decisions on buying or selling a security. Here's a detailed explanation:
-
Understanding the Simple Moving Average (SMA):
-
The SMA is calculated by averaging the closing prices of a security over a specified period.
-
Common time frames for SMAs include 50 days, 100 days, and 200 days, but it can be adjusted based on the trader's preference and market conditions.
-
Identifying Trends with SMAs:
-
In an uptrend, the price is generally above the SMA, while in a downtrend, it's below.
-
Traders use different SMAs (short-term and long-term) to identify crossovers, where the shorter-term SMA crosses above or below the longer-term SMA, signalling potential trend changes.
-
Entry and Exit Signals:
-
Golden Cross (Bullish Signal): Occurs when a short-term SMA crosses above a long-term SMA, indicating a potential upward trend. Traders may consider buying at this point.
-
Death Cross (Bearish Signal): Happens when a short-term SMA crosses below a long-term SMA, suggesting a potential downward trend. Traders might consider selling or shorting.
-
Risk Management:
-
Traders often combine SMAs with other indicators and risk management strategies to confirm signals and minimize false alarms.
-
Setting stop-loss orders based on the recent price volatility helps manage potential losses.
-
Back testing and Optimization:
-
Before implementing the strategy, traders often back test it on historical data to assess its performance.
-
Optimizing the strategy involves adjusting the SMA periods to find the most effective combination for a particular security or market condition.
-
Monitoring and Adapting:
-
Regularly monitoring the SMA signals and adapting the strategy based on changing market conditions is crucial.
-
Adjusting SMA periods or incorporating additional indicators can enhance the strategy's effectiveness.
-
Example:
-
If a trader sees a Golden Cross (short-term SMA crossing above the long-term SMA), it may signal a potential bullish trend, prompting the trader to consider buying the security.
-
Conversely, a Death Cross (short-term SMA crossing below the long-term SMA) may suggest a bearish trend, prompting the trader to consider selling or shorting.
Remember, while SMA strategies can be effective, they're not foolproof, and it's essential to consider the broader market context and other factors before making trading decisions.
Simple Moving Average Strategy:
The chart below represents the (SMA) average of the closing price of crude oil over a specified number of periods. Here the moving average changes based on the changes in crude price.
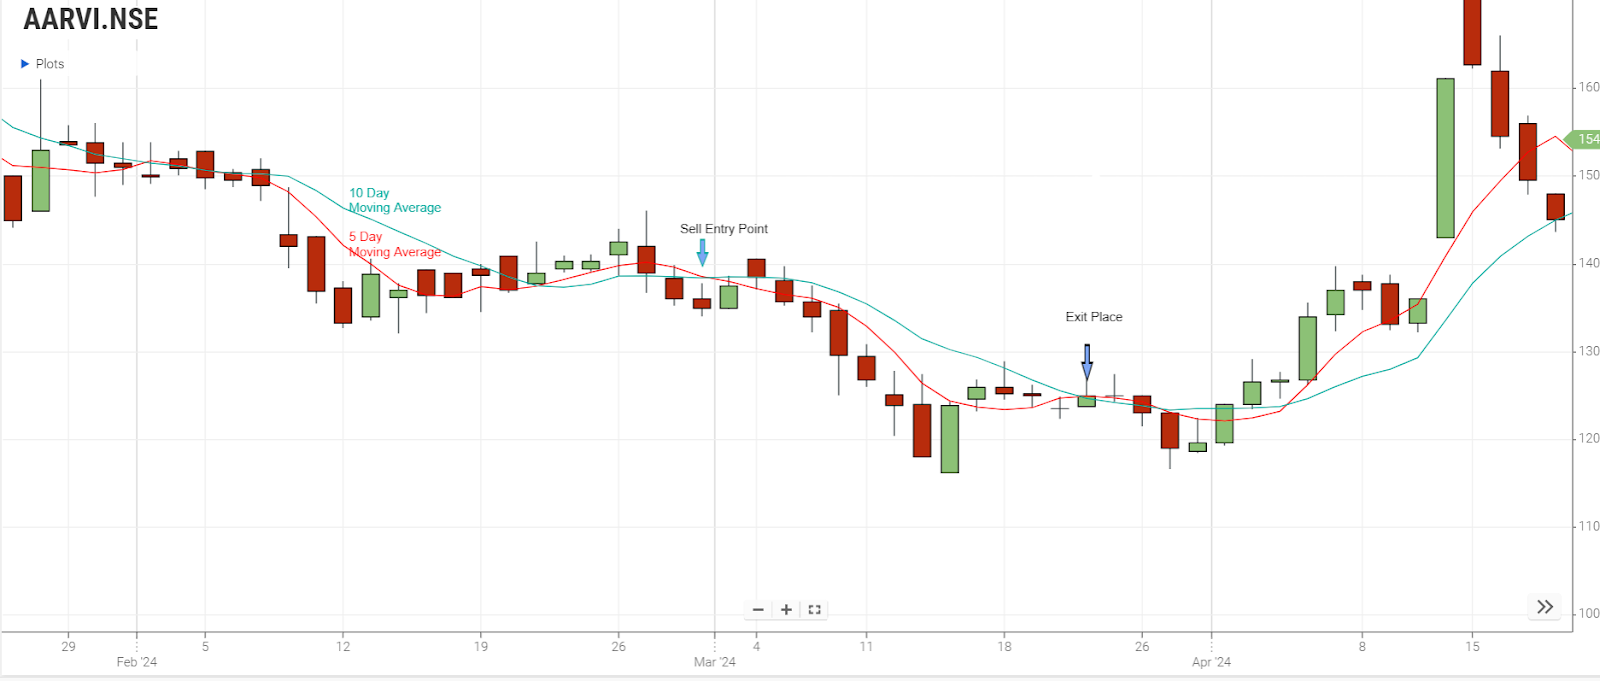
1. Utilizing a 5-day moving average (depicted by the green line) and a 10-day moving average (represented by the blue line).
Examining the chart reveals that the five-day moving average calculates the average closing price over the last five days, with older data gradually phased out as the moving average progresses. This method effectively smoothens short-term fluctuations in crude prices, providing a clearer indication of the market trend.
Observing the chart, when crude prices rise, the short-term moving average crosses above the long-term moving average, signalling an upward trend. Conversely, during a decline in crude prices, the long-term moving average crosses over the short-term one, indicating a shift in price trends. It's important to note that the SMA functions as both support and resistance levels.
- Support Level: When the moving average is below the current market price of crude.
- Resistance Level: When the moving average is above the current market price of crude.
Traders often use the crossover of the five-day and ten-day moving averages as entry and exit points. A crossover where the five-day SMA surpasses the ten-day SMA serves as an entry signal, while a crossover with the ten-day SMA exceeding the five-day SMA is considered an exit signal in an uptrend, and vice versa in a downtrend.
SMA Calculating Formula
The Simple Moving (SMA) formula is:
SMA = [{P {1} + P {2} + ... + P{n}} \ n]
where (P {1}, P {2}, ..., P{n}) are the closing prices of the security over (n) periods. The SMA provides a smoothed average, aiding in trend analysis in the stock market.
SMA Example
Suppose Maria is analyzing the stock performance of ABC Corporation. She wants to calculate the Simple Moving Averages (SMA) based on the closing prices of the last 4 days.
The closing prices for ABC Corporation over the last 4 days are: Rs.50.20, Rs.51.00, Rs.49.80, and Rs.50.50. Average
The SMA can be computed as follows:
SMA = [{50.20 + 51.00 + 49.80 + 50.50}/ {4}]
Therefore, the SMA for ABC Corporation is {Rs.201.50}/ {4} = Rs. 50.38
Frequently Asked Questions
What Is Moving Average in Share Market?
A moving average in the stock market is a statistical calculation used to analyze trends by smoothing out price data over a specific period. It helps traders identify the direction of the trend, offering insights into potential entry or exit points for investments based on historical price movements. Short-term moving averages react quickly to recent price changes, while long-term moving averages provide a broader perspective on market trends.
Is Moving Average and Simple Moving Average Same?
Yes, a moving average and a simple moving average (SMA) are essentially the same concept in stock market analysis. The SMA is a specific type of moving average that calculates the average price of a security over a defined time period, providing a smoothed trend line to aid in technical analysis. Other types, like exponential moving averages, may apply different weights to prices, but the basic principle of smoothing data remains consistent.
What Is the Simple Moving Average?
A Simple Moving Average (SMA) in the stock market calculates the average closing price over a specific period, smoothing out price fluctuations. Traders use SMAs to identify trends and potential entry or exit points.
How To Calculate 5 day moving average?
To calculate a 5-day Simple Moving Average (SMA):
-
Sum the closing prices of the last 5 days.
-
Divide the sum by 5 (the number of days).
-
Repeat the process daily, updating with the latest closing price for a smoothed 5-day average indicative of short-term trends
Is SMA suitable for long-term or short-term trend analysis?
SMA is versatile and can be applied to both long-term and short-term trend analysis based on the chosen time frame, such as 50 days for short-term or 200 days for long-term analysis.