Knowledge Center Technical Analysis
Moving Averages
Displacing Moving Average
To forecast trends, the usual moving average is displaced either forward or backward in the chart. We call this "Displaced moving average” as we take the moving average and shift it by a number of intervals. It is generally used in trading strategies to improve the usual moving averages.
Displaced Moving Average (DMA) is a powerful tool that offers insights into the price movements and market trends. Many traders employ DMA to strategize entry and exit into the market.
DMA is a type of Simple Moving Average (SMA) technical indicator, which is used to average the price data and identify and analyze market trend changes.
We call this "Displaced moving average” as we take the moving average shift by a number of intervals.
In DMA, to forecast trends, the simple moving average is displaced either forward or backward in time on the chart to create a displaced version of average.
By this , DMA separates the SMA line from the current price action pattern, which helps traders to compare the relationship between prices and DMA line.
Displaced Moving Average Vs. Simple Moving Average
The graphical illustration below depicts the comparison of SMA and DMA.
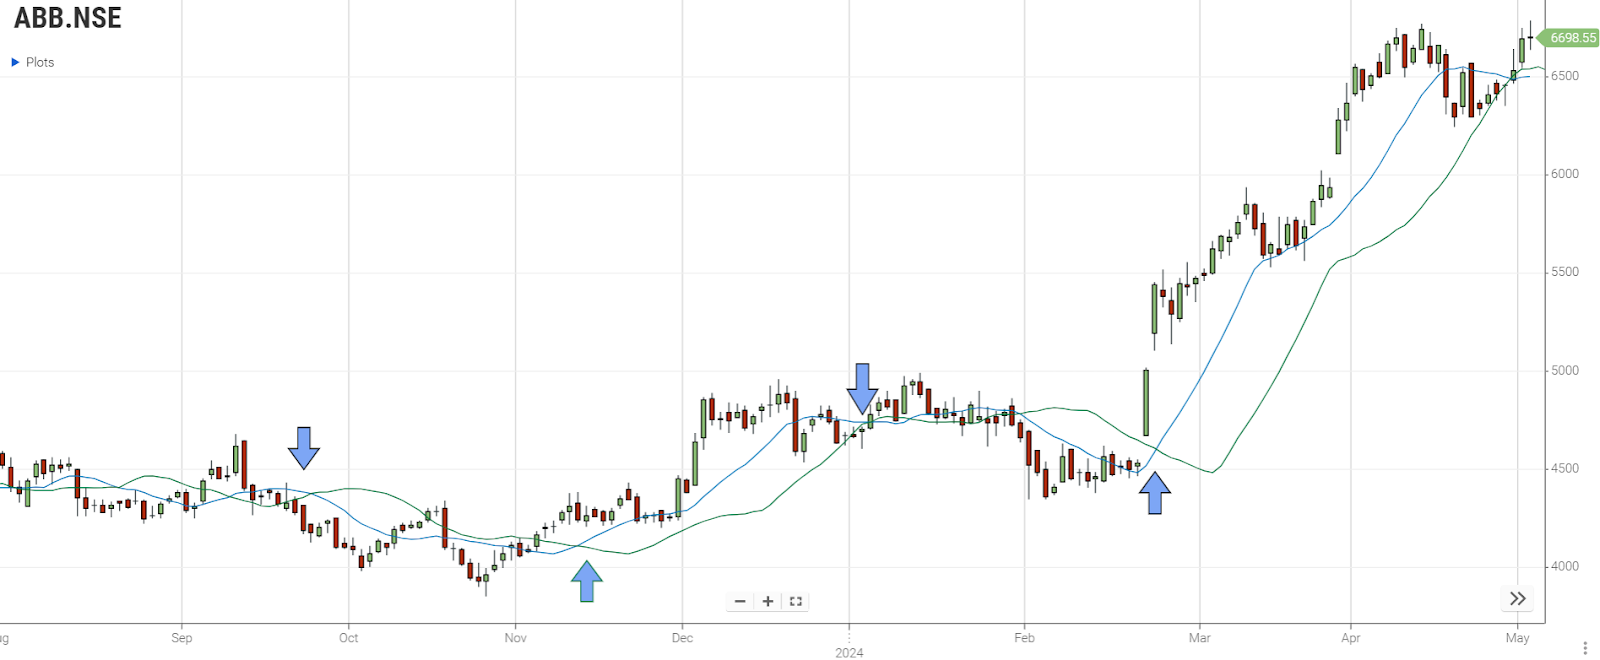
In the above illustration,
Blue Line SMA – indicates a 14 - day SMA on the daily chart .
Green Line DMA – indicates a 14 - day SMA displaced by 9 intervals on the same daily chart .
Note: These settings were adapted from DMA channel strategy.
To compute DMA, traders should choose a time interval and incorporate it into the SMA formula. This adjustment allows them to shift the moving average left or right on the chart according to their preference, tailoring the DMA to suit their analysis and trading strategy
SMA and DMA lines are highlighted over the candlestick charts in order to highlight price crossovers.
Inference – From the above illustration , we can infer that the price crosses the regular moving average before crossing the displaced moving average.
Displaced Moving Average Formula
The formula for calculating a Displaced Moving Average (DMA) involves two steps: first, calculating a Simple Moving Average (SMA) for a given period, and then displacing this SMA by a certain number of periods. Here's the formula:
-
Calculate the Simple Moving Average (SMA) for a specified number of periods (N):
SMA=Sum of prices over N periods / N
-
Displace the SMA by a certain number of periods (D) to get the Displaced Moving Average (DMA):
DMA= SMA[D]
In this formula, SMA[D] represents the SMA displaced by D periods. For example, if you want to calculate a 20-day DMA with a 5-day displacement, you would first calculate the 20-day SMA and then use the closing price from 5 days ago as the DMA value for today.
Displaced Moving Average Trading Strategy
The Displaced Moving Average (DMA) trading strategy involves using a moving average that has been shifted or displaced to the right or left of the price chart. This displacement can help traders identify trends and potential entry or exit points. Here's a basic outline of a DMA trading strategy:
-
Calculate the DMA: Choose a time period for the DMA (e.g., 20 days) and a displacement value (e.g., 5 days). Calculate the DMA by applying the displacement to a simple moving average (SMA) of the price data.
-
Identify Trend Direction: If the price is above the displaced moving average, it indicates an uptrend. If the price is below the DMA, it indicates a downtrend.
-
Entry and Exit Signals:
-
Buy Signal: Enter a long position when the price crosses above the displaced moving average, indicating a potential uptrend.
-
Sell Signal: Exit the long position when the price crosses below the DMA, indicating a potential downtrend.
-
Short Sell Signal: Enter a short sell position when the price crosses below the displaced moving average, indicating a potential downtrend.
-
Cover Short Sell Signal: Exit the short sell position when the price crosses above the DMA, indicating a potential uptrend.
-
Risk Management: Implement proper risk management techniques, such as setting stop-loss orders to limit potential losses.
-
Confirmation: Use other technical indicators or chart patterns to confirm signals generated by the DMA strategy.
-
Backtesting and Optimization: Backtest the strategy on historical data to assess its performance. Optimize the parameters (e.g., DMA period and displacement) based on the historical data to improve the strategy's effectiveness.
What Are The Effects Of Using A Displaced Moving Average?
-
Less crossover signals
-
More reliable signals, filtering out small trends.
-
More lag in signals
-
We need to understand the impact of shifting moving averages before applying them to our trading strategies.
-
The difference between a fast-moving average (shorter setting) and a slow-moving average (more extended period setting)
-
Displacing moving averages in the right gives more lag, and the left helps cycle analysis.
Frequently Asked Questions
What Are the Effects of Using a Displaced Moving Average?
-
Less crossover signals
-
More reliable signals, filtering out small trends.
-
More lag in signals
-
We need to understand the impact of shifting moving averages before applying them to our trading strategies.
-
The difference between a fast-moving average (shorter setting) and a slow-moving average (more extended period setting)
-
Displacing moving averages in the right gives more lag, and the left helps cycle analysis.
How to utilize DMA in the stock market?
DMA, or Displaced Moving Average, is used in the stock market to smooth out price data and identify trends over a specific time period. By displacing the moving average to the left or right on the chart, traders can observe how it relates to current price action. DMA helps traders spot potential trend reversals, support, and resistance levels, aiding in their decision-making process.
How Does DMA Work in the Stock market?
DMA works by calculating the average of a set number of past closing prices and plotting a certain number of bars back from the current price. This time lag helps traders identify potential market turning points, trends, as well as resistance and support levels in the stock market.
Advantage of applying DMA in Stock Market
DMA provides valuable insights to investors, including:
-
Market Directions or Trends: DMA helps identify prevailing market trends. When the price is above the DMA, it indicates an uptrend; when below, a downtrend. By observing this relationship, traders can better understand market momentum.
-
Resistance and Support Levels: DMA can act as dynamic resistance or support on the price chart. Traders often look for price bounces off the DMA, providing potential buying or selling opportunities. When the price crosses the DMA, it can change from being a resistance to a support level, and vice versa.
Limitations of DMA in the stock market?
Displaced Moving Average (DMA) can be slow, not ideal for fast changes. In volatile markets, it might not reduce noise well, missing important price moves. It's best used with other indicators, as relying on DMA alone can lead to misinterpretations. In sideways markets, DMA can give false signals. It's also sensitive to outliers, which can distort its signals. DMA needs a lot of historical data, so it may not work well in situations with limited data.