Knowledge Center Technical Analysis
Moving Averages
Least Square Moving Averages or Linear Regression
The least squares moving average (LSMA) or linear regression moving average, helps predict where an asset's price might go. It looks at past market data like price and trading volume. LSMA is a type of moving average that calculates an asset's average price over time. Unlike regular moving averages, LSMA uses a method called least-squares to make its predictions. It's a tool used in technical analysis to show trends and potential reversals in the market.
The Benefits of the LSMA Indicator
Here are the key points about how the LSMA indicator is helpful:
-
Identifying Trends: LSMA helps traders know if the market is going up (uptrend) or down (downtrend).
-
Trend Following: During an uptrend, the LSMA moves up, and during a downtrend, it moves down.
-
Continued Movement: Even after a trend ends, LSMA keeps moving in the same direction for a while.
-
Reversal Signals: Traders use LSMA to spot potential trend changes. If LSMA rises above the price in an uptrend, it suggests a possible shift to a downtrend. Conversely, if LSMA drops below the price in a downtrend, it indicates a potential shift to an uptrend.
How is the least squares moving average calculated?
To calculate the least squares moving average, we utilize the least squares method, which involves finding a straight line that best fits the data for the chosen period. This method calculates the endpoint of the line, which is plotted, and the process is repeated for each subsequent period.
The formula used to determine the line of best fit is:

How to Trade using LSMA
In the chart below, the LSMA indicator (shown as the black line) has been applied to the daily chart of Reliance. The default settings of 47-Day LSMA have been used. The LSMA generates signals when the price moves away from the indicator.
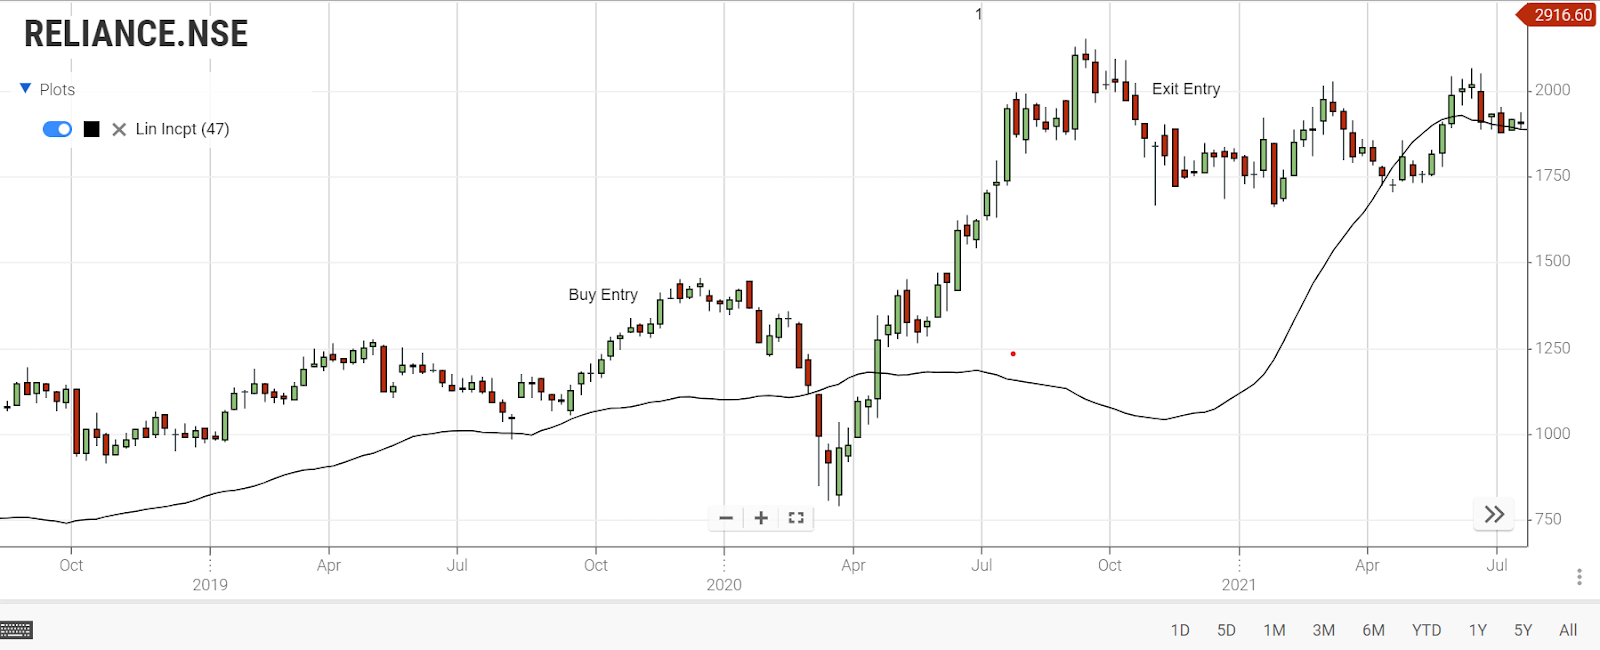
Similar to other moving averages, it's essential to monitor the least squares moving average for signs of a trend shift. If the LSMA indicates an uptrend alongside price recovery, it generates a buy signal. Conversely, if the LSMA indicates a downtrend along with a price decrease, it generates a sell signal.
Methods of using LSMA or Linear regression
The Least Squares Moving Average (LSMA) is ideally utilized in a manner akin to other moving averages, following a consistent conceptual approach. Here, we explore some of these strategies for effective implementation.
Trend strategy with LSMA:
Trend following is a trading approach where investors aim to buy and hold assets while they are on an upward trajectory. This strategy is grounded in Newton's Law of Motion, suggesting that an asset's price tends to move in the same direction until counteracted by an opposing force.
In this context, the LSMA indicator becomes invaluable. It helps traders anticipate crossovers, indicating potential shifts in the trend.
For instance, examining the chart below featuring TATAMOTORS share price reveals an uptrend. As long as the stock price remained above the LSMA, it signified a continuous upward trend, aligning with the trend-following strategy's principles.
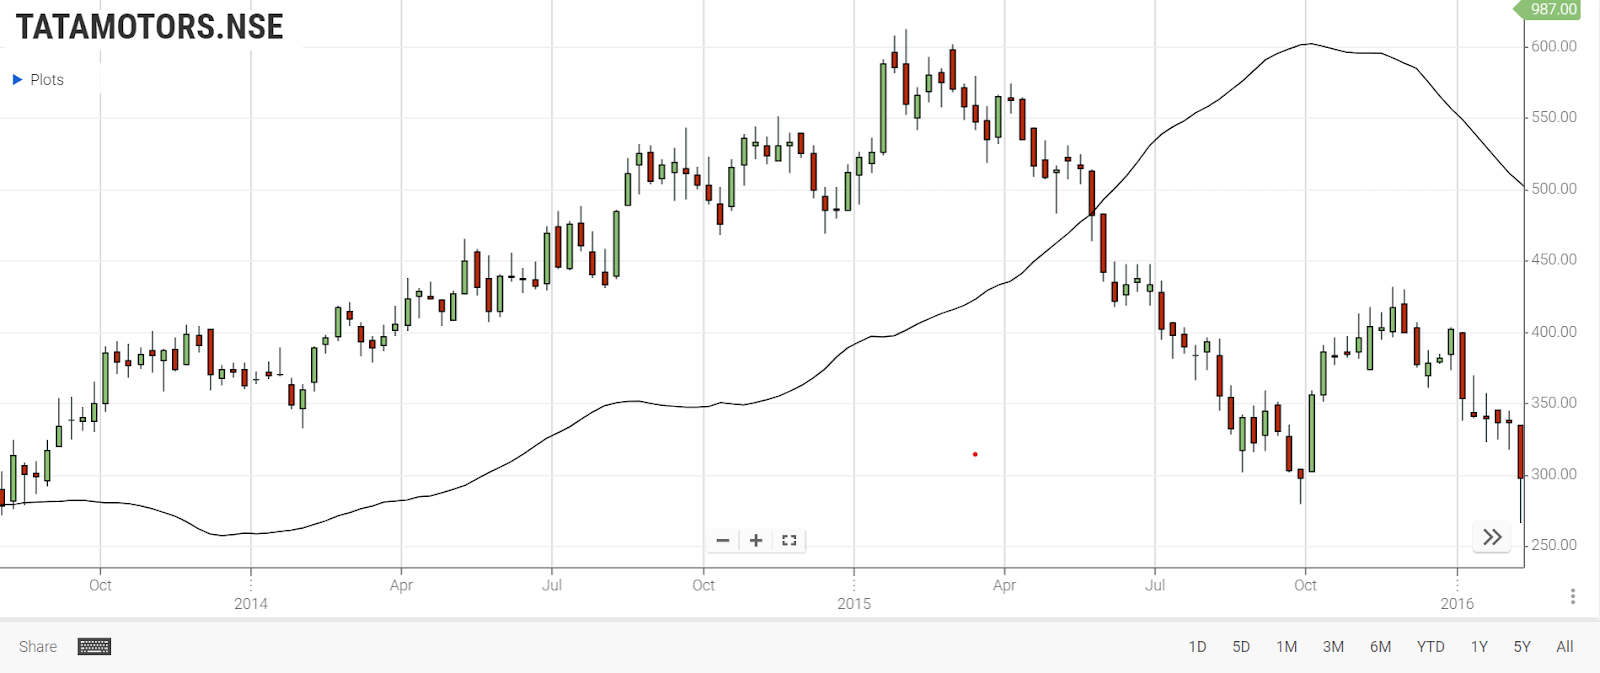
Hence, you could have kept the stock and sold it when it showed a bearish crossover.
Using LSMA with Other Indicators:
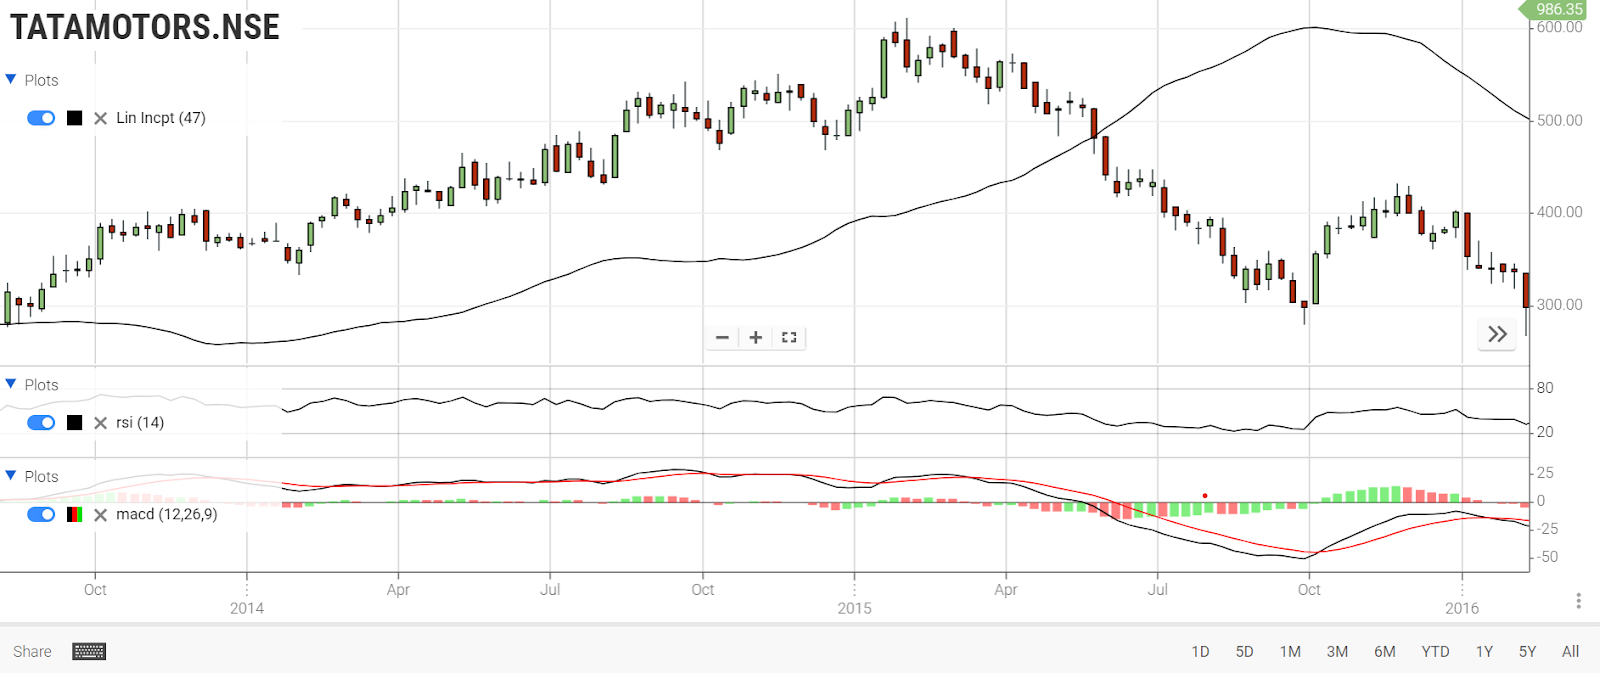
Another effective way to utilize LSMA is by combining it with other technical indicators such as the Relative Strength Index (RSI) and the MACD.
While LSMA indicates trends, RSI and MACD are oscillators commonly used to identify overbought and oversold levels and confirm new trends.
For instance, observing the chart below, if the Relative Strength Index is rising along with the LSMA indicator, it can signal a continuous bullish trend, reinforcing the strength of the upward market movement.
NutShell
-
LSMA, or least squares moving average, relies on least squares regression for past time periods.
-
Similar to other moving averages, the LSMA indicates bullish or bearish trends through crossovers with different periods.
-
Caution is necessary when there's a significant price deviation from LSMA, as it can lead to inaccurate signals.
-
LSMA often provides misleading signals, making it unreliable even when combined with other indicators.
-
The indicator struggles to confirm definite trends, reducing its overall reliability for traders.
-
Day traders are recommended to avoid relying solely on LSMA and opt for more dependable indicators for accurate market analysis.
Frequently Asked Questions
-
What does LSMA stand for, and how does it differ from the Linear Regression Moving Average?
LSMA, or least squares moving average, uses the least squares method to predict an asset's price. Linear Regression Moving Average, on the other hand, employs linear regression to calculate the average price over time.
-
What is the formula for the least squares moving average?
The formula for LSMA involves the least squares method and data points to find the best-fit line, which represents the moving average over the chosen period.
-
How does LSMA differ from traditional moving averages?
Unlike regular moving averages, LSMA uses the least squares method, providing a more accurate prediction of price trends. It's a blend of linear regression and moving average concepts.
-
Can you explain the equation for the least squares regression line in simple terms?
Certainly, the least squares regression line represents the best-fit straight line through data points, minimizing the sum of squared differences between observed and predicted values. It's fundamental to LSMA calculations.
-
How do I calculate the least squares regression line and the least squares moving average?
To calculate LSMA, use the least squares method formula, incorporating historical data points. The result is a line that predicts future prices. Similarly, the least squares regression line is calculated using data points to find the best-fit line using the least squares method.
-
how to calculate ordinary least squares
Ordinary Least Squares (OLS) is a variation of the least squares method used in LSMA. It minimizes the sum of squared errors, providing an accurate regression line. Traders use this to predict price movements and trends effectively.