Knowledge Center Technical Analysis
Moving Averages
Weighted Moving Average
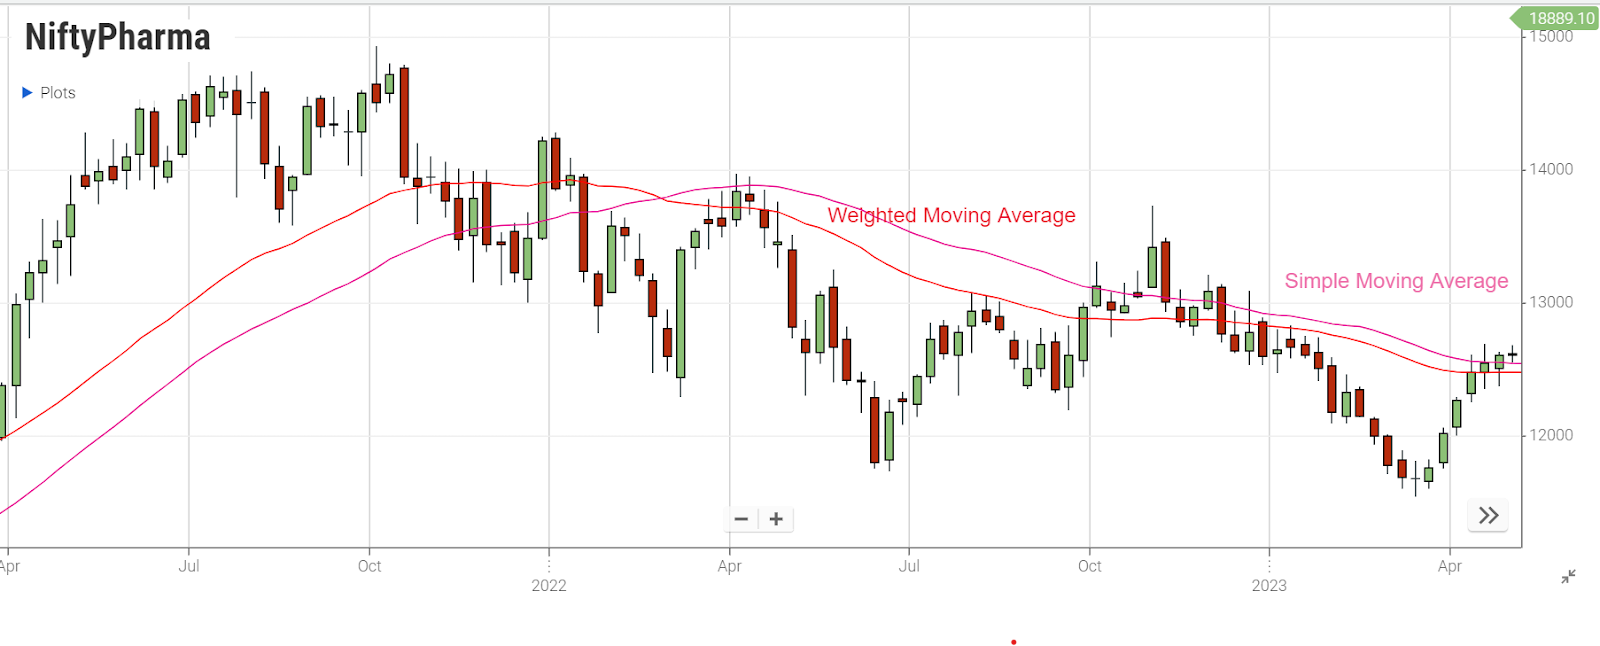
The weighted moving average calculation is a technique traders employ for weighted moving average forecasting. It involves assigning greater weight to recent data points and less weight to past data points when calculating the moving average. This method helps traders generate signals for trade direction and make informed decisions regarding buying or selling assets. When the price action approaches or exceeds the weighted moving average, it may suggest a potential exit point for a trade. Conversely, when the price action dips near or below the weighted moving average, it could indicate an opportune time to enter a trade. Compared to a simple moving average, which treats all data points equally, the weighted moving average provides a more accurate assessment of trend direction.
weighted moving average calculation
When calculating the weighted moving average, recent data points are assigned greater weight, while past data points are assigned less weight. This method is used when the data set consists of numbers with different weights relative to each other, with the total weight summing up to 1 or 100%.
Contrary to the simple moving average, where all numbers are given equal weight, the weighted moving average assigns importance to each data point based on its significance. Hence, it provides a more detailed reflection of concurrency frequency than the simple moving average.
The example below provides a clear demonstration of how a five-day weighted moving average is computed. The weighting is determined by the number of days in the moving average, with a weight of 1.0 assigned to the first day and 5.0 assigned to the most recent day. This means that today's price is given five times more weight than the price from five days ago.
Five-Day Weighted Moving Average
|
Day No |
Weight |
Price |
Weighted Average |
|
1 |
1 |
25 |
25 |
|
2 |
2 |
26 |
52 |
|
3 |
3 |
28 |
84 |
|
4 |
4 |
25 |
100 |
|
5 |
5 |
29 |
145 |
|
Total |
15 |
133 |
406 |
|
Average: 27.067 |
|||
The recent price values are accorded greater "weightage" compared to the older ones, functioning similarly to the Simple Moving Average (SMA).

-
In an uptrend, the weighted moving average acts as a support for price movements, providing a level where prices tend to bounce off.
-
During a downtrend, the weighted moving average serves as a resistance to price movements, hindering upward movement.
-
Significant attention is paid when the price crosses the weighted moving average.
-
When the price breaks below (moving from above to below), the weighted moving average indicates a potential price decline.
-
Conversely, when the price breaks above (moving from below to above), the weighted moving average suggests a potential price rise.
Weighted Moving Average Formula
The Weight Moving Average Formula is provided below.
The difficulty encountered when employing the moving average.
The challenge encountered when utilizing the moving average is identifying the moment when prices intersect with the moving average line.
Determining whether this intersection point is crucial for predicting price movements. A recommendation for confirming signals is to incorporate other oscillator indicators or candlestick patterns from technical analysis.
Moving average vs Weighted average
|
Indicator |
Characteristics |
Suitable For |
|
Weighted Moving Average (WMA) |
Assigns greater weight to recent price movements |
Short-term traders capturing fast shifts |
|
Simple Moving Average (SMA) |
Treats all data points equally |
Long-term traders analyzing trends |
|
Smoothed Moving Average |
Uses longer time frame to smooth out fluctuations |
Traders eliminating short-term noise |
Nutshell
-
Weighted Moving Average calculation aids in forecasting future trends by assigning more significance to recent data points.
-
The Weight Moving Average formula emphasizes recent price movements, offering valuable insights for short-term trading decisions.
-
Understanding the Weighted Moving Average is crucial for traders seeking to identify potential entry and exit points in the market.
-
When the price intersects with the Weighted Moving Average, it can signal shifts in market sentiment and potential trade opportunities.
-
Comparing different moving average indicators like WMA, SMA, and Smoothed Moving Average helps traders select the most suitable tool for their trading style.
-
Incorporating other technical analysis tools, such as oscillator indicators and candlestick patterns, can enhance the effectiveness of Weighted Moving Average forecasting.
Frequently Asked Questions
-
How to calculate weighted moving average?
Using the weighted moving average formula, multiply each value by its corresponding weight, sum up these products, and then divide by the total sum of weights in the dataset. This calculation yields the weighted average.
-
What is a Weighted Moving Average Calculator?
The Weighted Moving Average Calculator is a tool designed to compute the weighted moving average of a provided dataset based on the input vector of weight information.
-
What sets apart moving average vs weighted average?
Moving average computes based on the current inventory status after each transaction, while weighted average considers all purchases within a specified timeframe, giving more weight to recent transactions.
-
How to find weighted moving average?
Follow these steps for weighted moving average calculation”
-
Identify the numbers you want to average.
-
Determine the weights of each number.
-
Multiply each number by the weighting factor.
-
Sum up the resulting values to obtain the weighted average.
-
What are the benefits of weighted moving average forecasting?
Incorporating weighted moving averages enhances accuracy and responsiveness to data changes in financial analysis. Whether analyzing stock market trends or forecasting sales numbers, this technique aids in making informed decisions and staying ahead of the curve.
