Knowledge Center Technical Analysis
Moving Averages
How to Trade 200 Simple Moving Average
Simple moving average over 200 periods
The moving average is employed to create a simplified line, making it simpler for traders to understand market data like the current trend direction by smoothing out price fluctuations.
The chart illustration below showcases a 200-period moving average, calculated using data from the preceding 200 periods leading up to the current candle.
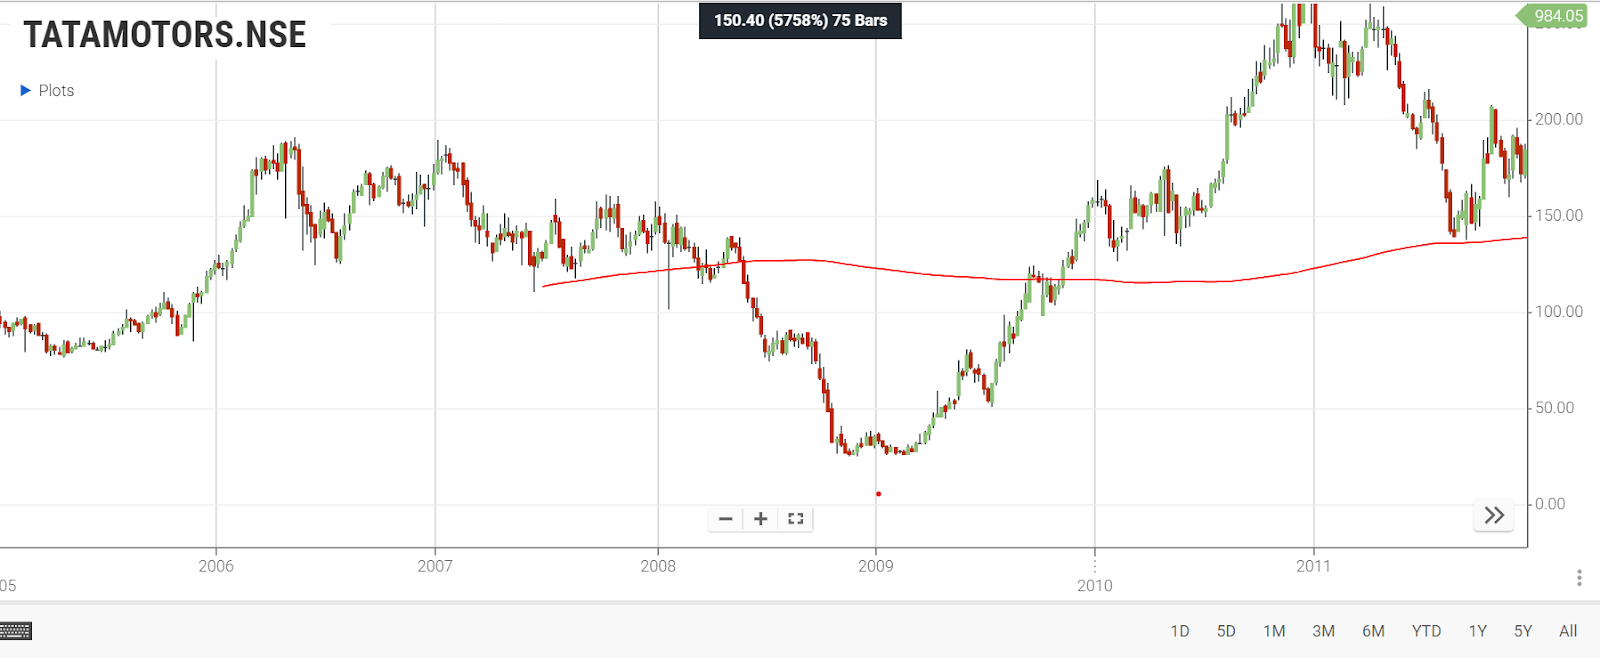
The chart illustration below demonstrates how the trend direction and strength can be assessed.
-
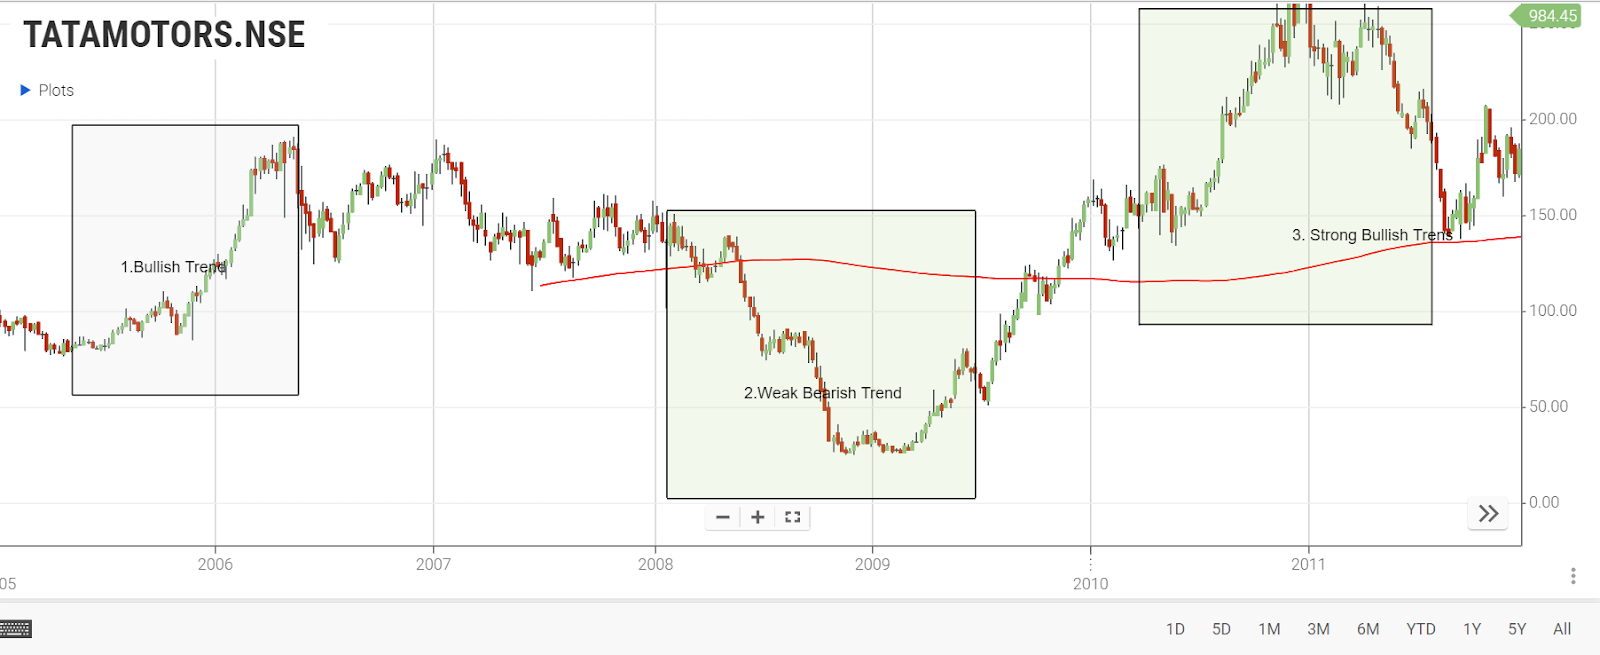
Observing the slope and angle of a moving average provides key insights into market behavior.
-
A steep slope of the moving average indicates a strong trend in the price action.
-
Traders use this information to gauge the intensity and direction of market trends for informed decision-making.
-
Number 1: A steep angle to the upside indicates a bullish trend, signaling a strong upward market movement.
-
Number 2: A flat angle within a range suggests a weak bearish trend, indicating limited downward market momentum.
-
Number 3: Another steep angle to the upside signifies a strong bullish trend, reflecting a robust and sustained upward market direction.
If the price is above the moving average, it usually means the price is higher than recent averages, indicating a bullish trend or upward movement.
On the other hand, if the price is below the moving average, it suggests a bearish trend or downward movement.
Recognizing these patterns helps traders decide which direction to trade in, guiding their trading strategies.
The choice of moving average depends on the specific time period being observed. Different time frames may show different moving average results, affecting the perceived trend.
Traders should also consider multiple moving averages on charts to get a complete view of market trends, ensuring well-informed decisions.
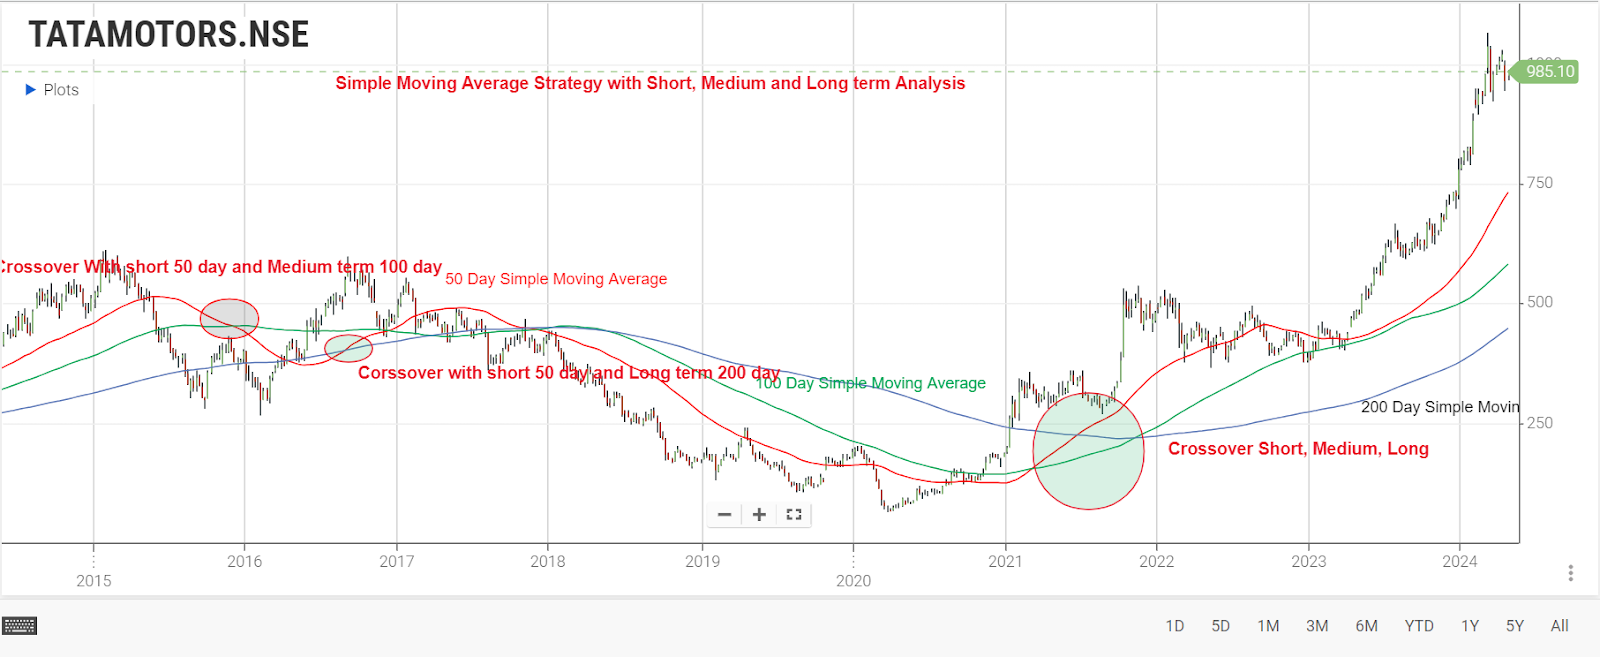
The 50-day moving average moves beyond the 200-day moving average
When the price is above the 50-day short-term moving average, it indicates an upward trend.
Trading above the 100-day moving average suggests a medium-term bullish trend.
If the price is above the 200-day moving average, it signifies a long-term uptrend in the market.
In the Chart,
-
The red line: represents the 50-day moving average, indicating a short-term trend analysis.
-
A green-colored line: signifies the 100-day moving average, indicating a medium-term trend evaluation.
-
A blue line: denoted as the 200-day moving average, serves as a tool for identifying long-term trends in the market.
1. Short-term Trend:
When oil prices are above the 50-day moving average, it signals a short-term bullish trend, indicating a potential upward movement. Conversely, if prices dip below this average, it suggests a short-term bearish trend, indicating a possible downward movement.
2. Medium-term Trend:
The 100-day moving average is crucial for understanding the medium-term trend. If prices remain above this average, it indicates a medium-term bullish trend, showing stability and potential growth. Conversely, prices falling below the 100-day moving average indicate a medium-term bearish trend, suggesting instability and potential decline.
3. Long-term trend:
For a broader perspective, the 200-day moving average is observed. Prices above this average signify a long-term uptrend, indicating sustained growth over an extended period. On the contrary, prices below the 200-day moving average point to a long-term downtrend, indicating a prolonged period of decline.
Crucial Signals in Crude Oil Analysis:
-
Bullish Signals:
When the 50-day moving average crosses above the 100-day moving average, it indicates a medium-term bullish signal, suggesting a potential uptrend.
Strong confirmation of a bullish trend occurs when all three moving averages - 50-day, 100-day, and 200-day - align positively, indicating a robust and sustained uptrend.
-
Bearish Signals:
Conversely, when the 50-day moving average crosses below the 100-day moving average, it signifies a short and medium-term bearish signal, suggesting a possible downward movement.
A significant downtrend is confirmed when all three moving averages turn bearish, indicating a prolonged period of decline.
Nutshell
-
Short-Term Clarity: The 50-day SMA reveals short-term shifts in crude oil prices.
-
Long-Term Insight: The 200-day moving average uncovers long-term market trends.
-
Informed Trading:Trading becomes more effective with clear trends and buy/sell signals.
-
Dual Trend Analysis: Traders utilize moving averages for both short-term and long-term trend identification.
-
Multiple Averages for Clarity: Multiple moving averages help pinpoint distinct uptrends and downtrends.
-
Confirming Market Trends: Moving averages align with price trends during clear market directions, aiding traders in decision-making.
Frequently Asked Questions
1. How do I calculate the 200-day moving average?
Add the closing prices for the last 200 days and divide by 200.
2. What is the 200-day moving average?
It's the average of a stock's closing prices over 200 days, indicating long-term market trends.
3. How do I read moving averages?
Moving averages smooth out price data, revealing trends by indicating the average price over a specific period.
4. What is SMA in the stock market?
SMA stands for Simple Moving Average, a commonly used indicator showing average prices over a specific time frame.
5. When the 50-day moving average crosses 200, what does it mean?
It signals a "Golden Cross," suggesting potential upward price movement and a bullish trend.
6. What are 50 DMA and 200 DMA?
50 DMA (day moving average) and 200 DMA represent average prices over 50 and 200 days, respectively, helping identify trends in stock prices.