Mastering Swing Trades: Insights from Metal and FMCG Sectors in Nifty

NIFTY METAL
Nifty Metal Index represents the performance and behaviour of the metal sector (including mining) in India. Nifty Metal comprises 15 stocks (maximum) that are listed and trading on NSE.
Free float market capitalization method is used to compute the Nifty Metal Index. Nifty Metal Index Level is the total free float market value of all the stocks in the index relative to particular base market capitalization value.
This Nifty Metal Index is used for fund portfolios benchmarking, launching of index funds, Exchange Traded Funds and structured products.
Mastering Swing Trades: Insights from Metal and FMCG Sectors in Nifty
Adani Enterprises Limited
Recent Trends
December 2024:
Regulatory Settlement: Adani Enterprises began negotiations with SEBI to settle the matter of public shareholding compliance.
Copper Smelter Expansion: Its unit, Kutch Copper Ltd., at Mundra in Gujarat will reach its full capacity by early 2025.
January 2025
Profit Decline: Q3 FY24 net profit fell to Rs.57.83 crore from Rs.1,888.45 crore in the same period last year.
February 2025:
Environmental Controversy: Adani Enterprises is facing legal issues due to environmental non-compliance w.r.to a Rs.16,000 crore power project .
Nestlé India Limited
Recent Trends
December 2024:
Financial Performance:
The standalone net profit of Nestlé India for Q3 2024 increased to Rs.696.13 crore from previous year's profit of Rs.655.61 crore. Further, the sales increased by 3.89% at Rs.4,762.13 crore.
Dividend Declaration:
Nestlé India issued a second interim dividend of Rs.14.25 per share on February 7, 2025.
Constituents
|
Company Name |
Symbol |
Sectoral Distribution |
|
TATASTEEL |
19.92% |
|
|
HINDALCO |
15.17% |
|
|
ADANIENT |
14.77% |
|
|
JSWSTEEL |
14.00% |
|
|
VEDL |
6.57% |
|
|
JINDALSTEL |
4.98% |
|
|
APLAPOLLO |
4.79% |
|
|
NMDC |
4.50% |
|
|
JSL |
3.58% |
|
|
SAIL |
3.17% |
|
|
NATIONALUM |
2.40% |
|
|
HINDCOPPER |
1.70% |
|
|
RATNAMANI |
1.62% |
|
|
HINDZINC |
1.44% |
|
|
WELCORP |
1.38% |
Adani Enterprises Limited
Adani Enterprises Limited , a multinational Indian integrated infrastructure firm with diversified business operations like mining, energy , transport infrastructure, copper metal , digital including FMCG.
Adani Enterprises Limited has a market capitalization of Rs.361220.76 crores and is sub categorized as ‘Commodities Trading’ under Metal Sector.
Intraday Price Analysis
|
Adani Enterprises Limited as on 29th February 2024 |
||||
|
Current Price |
Open Price |
Today High |
Today Low |
Price Change |
|
Rs.3268.95 |
Rs.3220.05 |
Rs.3270 |
Rs.3205.35 |
48.9 |
Monthly Price Analysis
|
Date |
Price |
Open |
High |
Low |
Volume |
Chg% |
|
Fe-24 |
3,261.00 |
3,156.00 |
3,344.00 |
3,085.80 |
1.36M |
3.92% |
|
Jan-24 |
3,138.00 |
2,855.00 |
3,199.00 |
2,806.90 |
56.89M |
10.15% |
|
Dec-23 |
2,848.95 |
2,370.00 |
3,154.55 |
2,354.10 |
102.05M |
20.79% |
|
Nov-23 |
2,358.55 |
2,299.00 |
2,512.40 |
2,142.00 |
41.56M |
2.78% |
|
Oct-23 |
2,294.65 |
2,418.00 |
2,538.00 |
2,167.05 |
29.76M |
-4.94% |
|
Sep-23 |
2,413.90 |
2,381.00 |
2,630.25 |
2,380.00 |
67.08M |
-0.22% |
|
Aug-23 |
2,419.25 |
2,504.85 |
2,722.40 |
2,383.75 |
138.67M |
-2.93% |
|
Jul-23 |
2,492.20 |
2,405.00 |
2,518.00 |
2,340.00 |
52.18M |
4.36% |
|
Jun-23 |
2,388.05 |
2,499.90 |
2,560.00 |
2,163.30 |
132.79M |
-4.22% |
|
May-23 |
2,493.35 |
1,935.00 |
2,759.45 |
1,785.35 |
161.70M |
29.53% |
|
Apr-23 |
1,924.95 |
1,750.45 |
1,944.00 |
1,671.55 |
58.22M |
9.97% |
|
Mar-23 |
1,750.45 |
1,424.00 |
2,135.00 |
1,407.90 |
228.03M |
28.35% |
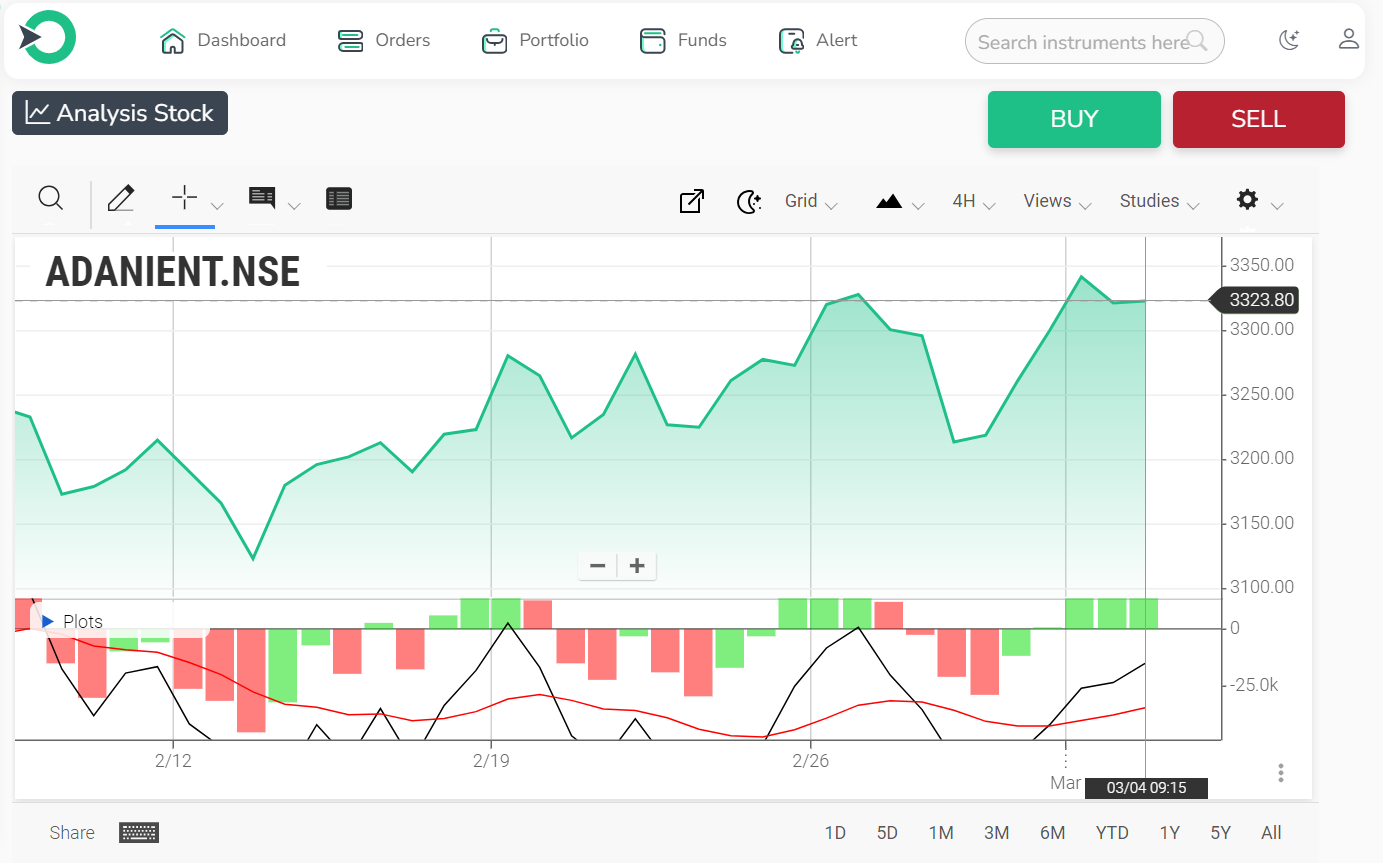
On analysis of Adani’s Enterprises Limited’s monthly price data, it is inferred that the stock displays bullish signals forming a bullish continuation Heikin Ashi Pattern.
Fundamental Analysis
Valuation Analysis
-
PE ratio is 107.11 for TTM indicating that the stock is overpriced and also intimates that the stock is in bearish trend.
-
PB ratio is 10.41 (Very poor) indicating that the stock is extremely overpriced and also intimates that the stock is following a bearish trend.
-
EV to EBITDA is 32.23 indicating that the stock is overpriced
-
ROA is 2.50% for TTM (not good)
-
ROE is 10.27% for TTM (not good)
-
The valuation key ratios indicate that Adani Enterprises Limited stocks are extremely overpriced indicating a strong bearish downtrend.
Profitability Analysis
-
Piotroski's score is excellent at 8 out of 9.
-
EPS growth for TTM is 30.83 is very good with 208.50% positive YoY growth.
-
The EBITDA margin is in uptrend for the past 3 years.
-
ROE for TTM average at 10.27% .
-
Dividend yield is very low at 0.04%
-
Net Profit Margin for TTM is extremely low at -3.26%
-
Operating Profit Margin for TTM is poor at -7.79%
-
ROA for TTM is poor at -2.50%
-
These profitability key ratios indicate that Adani Enterprises Limited stocks are displaying strong bearish downtrend.
Growth Analysis
-
Net Sales on YoY basis growth is 97.32%
-
Gross Profit on YoY basis is 118.81%
-
It is inferred that annual sales have been in uptrend for the past three years. Similarly, total assets have been in uptrend for the past three years.
Stability Analysis
-
D/E ratio is 1.24 indicating that the stock has stable debts .
-
Cash ratio is 0.179 indicating liquidity insufficiency .
-
Quick ratio is 0.674 also indicating insufficient liquid assets
-
Debt to EBITDA is 3.99
-
Overall Adani Enterprises Limited indicates good stability at Altman’s Z-Score of 3.33 indicating safe zone for the stock.
Technical Analysis
Indicators
Enrich Money’s Orca app provides greater insights on stock momentum with its technical and fundamental analysis.
As per Orca’s technical indication, the momentum of Adani Enterprises Limited is given below
|
Type |
Value |
Momentum |
|
RSI |
33.36 |
Neutral |
|
CCI |
-101.95 |
Bullish |
|
Williams_R |
-77.94 |
Neutral |
|
UO |
38.61 |
Bullish |
|
Rate of Change |
-0.23 |
Bearish |
|
MACD |
-16.33 |
Bullish |
|
ADX |
0 |
Bearish |
Moving Averages
|
Day |
SMA |
EMA |
|
5 |
3277.08 |
3262.47 |
|
50 |
3062.42 |
3052.79 |
|
200 |
2591.41 |
2702.97 |
Inference :
-
The simple and exponential moving average displays bullish uptrend for 50- and 200-days period. whereas strong bearish down trending moving average signals are displayed during the period of 5 days
-
SMA & EMA Moving Averages Crossovers indicate there are signals of mild bullish to bullish signals for the period from 5 - 200 days .
Pivot Levels
|
Standard Pivot Levels of Adani Enterprises Limited as on 29th February, 2024 |
||||||
|
S3 |
S2 |
S1 |
Pivot |
R1 |
R2 |
R3 |
|
3066.77 |
3137.13 |
3178.07 |
3248.43 |
3289.37 |
3359.73 |
3400.67 |
Risk Reward for Swing Trading
Based upon the pivot levels, fundamental and technical evaluation, we can infer that the stock price of Adani Enterprises Limited is overpriced and the indicators indicate that the stocks would follow a mild bullish uptrend in forthcoming days.
When applying swing trading strategies, the risk-reward ratio for Adani Enterprises Ltd. determined by pivot levels is calculated as below.
A swing trader can make a buy entry at Support Level ‘S1’ at Rs.3178.07 with stop loss order at price below Support Level ‘S1’ at Rs.3178. However, on a risk -reward basis, a trader can make calculative risk of 1:2 ratio, where for a buy entry at Support Level ‘S1’ at Rs.3178.07, he can take a calculative risk of 3%, i.e. Stop loss exit order at Rs.3082.73 and with a reward of 6%, i.e. the trader can set his target profit price as Rs.3368.75.
NIFTY FMCG
Nifty FMCG Index represents the performance and health of the FMCG sector (Fast Moving Consumer Goods) in India. Nifty FMCG consists of companies that operate on goods and products which are non-durable and depend upon mass consumer base. Nifty FMCG comprises 15 stocks that are listed and trading on NSE. Free float market capitalization method is used to compute Nifty FMCG Index.
Nifty FMCG Index is calculated by the Market capitalization of each stock is multiplied by its free-float factor, and the index value is the sum of these weighted market capitalizations, adjusted by the index divisor.
This Nifty FMCG Index is used by traders to speculate the short-term movements of the FMCG sector by trading in index futures and options.
The constituents of Nifty FMCG Index are
|
Company Name |
Symbol |
Sectoral Distribution |
|
ITC |
31.58% |
|
|
HINDUNILVR |
20.40% |
|
|
NESTLEIND |
8.23% |
|
|
TATACONSUM |
6.75% |
|
|
VBL |
5.91% |
|
|
BRITANNIA |
5.89% |
|
|
GODREJCP |
4.23% |
|
|
COLPAL |
3.29% |
|
|
MCDOWELL-N |
3.04% |
|
|
DABUR |
3.03% |
|
|
MARICO |
2.62% |
|
|
PGHH |
1.56% |
|
|
UBL |
1.28% |
|
|
RADICO |
1.24% |
|
|
EMAMILTD |
0.94% |
Nestle India Limited
Nestle India Limited , subsidiary of Nestle Group with 59.8% share ownership. It sells FMCG products like food, beverages, chocolates and confectionaries and also manages brands like Nescafe, Maggi, KitKat, Cerelac, Milkmaid, etc.
Nestle India Limited has a market capitalization of Rs.247702 crores and is sub categorized as ‘Consumer Food’ under FMCG Sector.
Intraday Price Analysis
|
Nestle India Limited as on 29th February 2024 |
||||
|
Current Price |
Open Price |
Today High |
Today Low |
Price Change |
|
Rs.2604.85 |
Rs.2571.45 |
Rs.2604.90 |
Rs.2547.05 |
33.4 |
Monthly Price Analysis
|
Date |
Price |
Open |
High |
Low |
Volume |
Chg% |
|
Feb-24 |
2,599.00 |
2,508.95 |
2,606.20 |
2,409.30 |
492.79K |
3.67% |
|
Jan-24 |
2,507.00 |
26,680.05 |
27,678.30 |
2,446.40 |
7.65M |
-5.68% |
|
Dec-23 |
2,658.03 |
2,433.99 |
2,665.00 |
2,413.86 |
20.24M |
9.67% |
|
Nov-23 |
2,423.61 |
2,420.00 |
2,458.99 |
2,377.31 |
12.15M |
0.01% |
|
Oct-23 |
2,423.48 |
2,250.69 |
2,474.50 |
2,225.51 |
18.79M |
7.68% |
|
Sep-23 |
2,250.69 |
2,205.00 |
2,306.29 |
2,163.25 |
10.83M |
2.37% |
|
Aug-23 |
2,198.64 |
2,260.83 |
2,293.82 |
2,145.00 |
13.25M |
-2.51% |
|
Jul-23 |
2,255.33 |
2,295.00 |
2,339.53 |
2,207.61 |
11.24M |
-1.49% |
|
Jun-23 |
2,289.43 |
2,178.60 |
2,317.53 |
2,157.28 |
13.86M |
5.63% |
|
May-23 |
2,167.31 |
2,180.00 |
2,230.00 |
2,127.50 |
17.42M |
-0.41% |
|
Apr-23 |
2,176.14 |
1,978.40 |
2,184.96 |
1,936.49 |
14.62M |
10.44% |
|
Mar-23 |
1,970.45 |
1,870.00 |
1,975.19 |
1,788.00 |
12.56M |
5.54% |
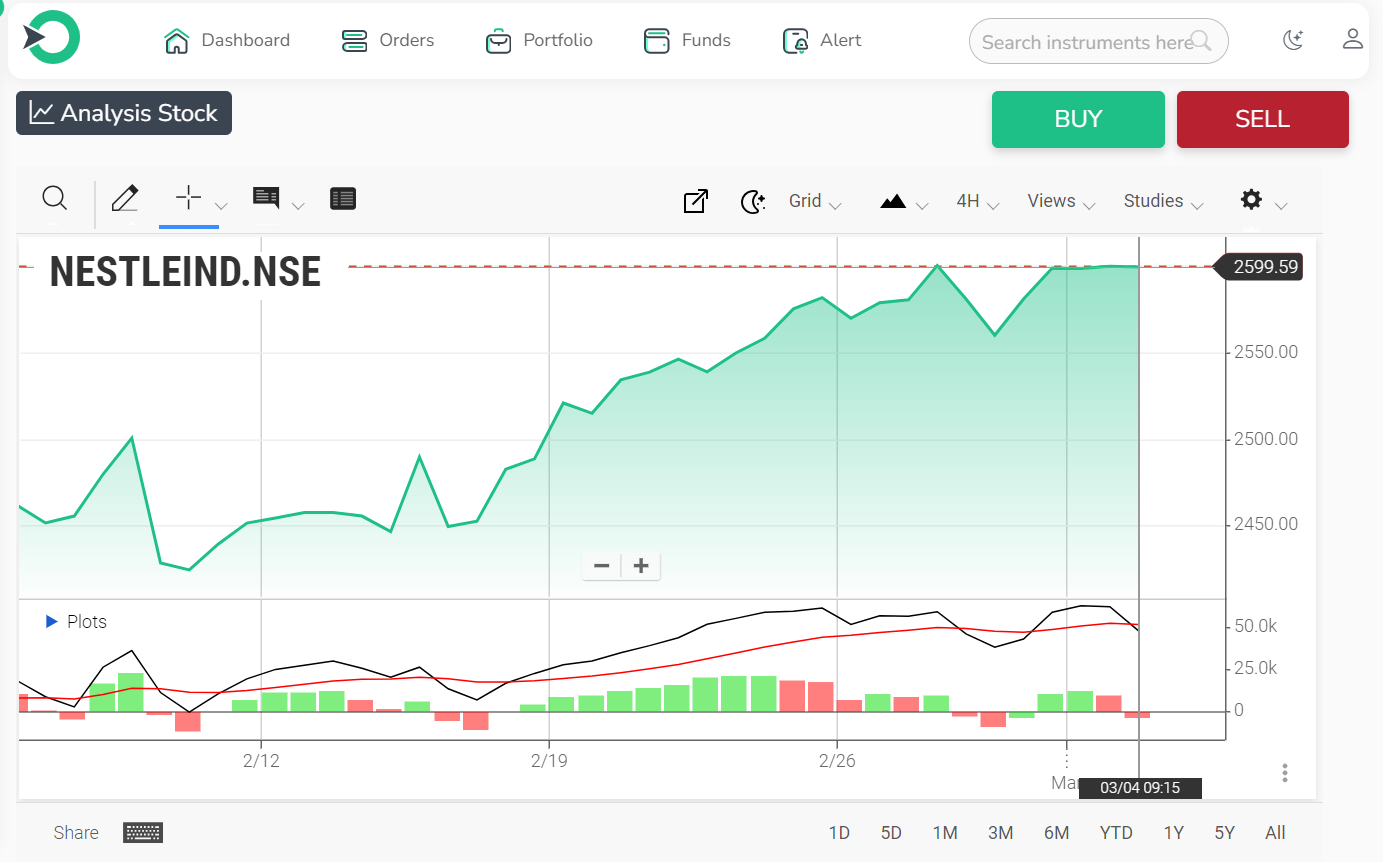
On analysis of Nestle India Limited’s monthly price data, it is inferred that the stock displays bullish signals forming a bullish Harami candlestick pattern with volume being very low.
Fundamental Analysis
Valuation Analysis
-
PE ratio is 268.65 for TTM indicating that the stock is overpriced and also intimating that the stock is in bearish trend.
-
PB ratio is 293.48 indicating that the stock is extremely overpriced and also intimating that the stock is following a bearish trend.
-
EV to EBITDA is 53.81 indicating that the stock is overpriced
-
ROA is 31.93% for TTM indicating strong return.
-
ROE is 109.24% for TTM indicating strong return.
-
The valuation key ratios indicate that Nestle India Limited stocks are overpriced with positive return indicating very low total shareholder’s return.
Profitability Analysis
-
Piotroski score is excellent at 8 out of 9.
-
EPS growth for TTM is 30.83 is very good with 208.50% positive YoY growth.
-
EBITDA margin is at 24.03%
-
ROE for TTM average at 109.24%
-
EPS has declined for the past four quarters.
-
Annual net profit margin is increasing in last 3 years with its TTM to be at 15.70%
-
Operating Profit Margin for TTM is at 21.29% with YoY positive changes.
-
Overall, all the net margins have crossed 15.70% and all TTM ratios have crosses 15%
-
These profitability key ratios indicate that Nestle India Limited stocks are displaying strong returns and asset growth.
Growth Analysis
-
Total sales are in uptrend in the past 3 years intimating multi fold growth potential with its net profit for YoY change to be increasing at 24.29%.
-
Gross Profit on YoY basis is 11.42%
-
It is inferred that annual sales have been in uptrend for the past three years. Similarly, total assets have been in uptrend for the past three years.
Stability Analysis
-
D/E ratio is 0.0209 indicating that the stock is debt free .
-
Cash ratio is 0.310 indicating liquidity insufficiency .
-
Quick ratio is 0.454 also indicating insufficient liquid assets
-
Debt to EBITDA is 0.0183 indicating that the stock is Debt Free and indicates its strong bullish nature.
-
Overall Nestle India Limited indicates good stability at Altman’s Z-Score of 24.11 indicating safe zone for the stock. The overall shareholder’s return stability is excellent.
Technical Analysis
Indicators
Enrich Money’s Orca app provides greater insights on stock momentum with its technical and fundamental analysis.
As per Orca’s technical indication, the momentum of Nestle India Limited is given below
|
Type |
Value |
Momentum |
|
RSI |
17.16 |
Bullish |
|
CCI |
105.17 |
Bearish |
|
Williams_R |
-7.33 |
Bearish |
|
UO |
72.14 |
Bullish |
|
Rate of Change |
5.50 |
Bullish |
|
MACD |
279.40 |
Bullish |
|
Stochastic |
90.94 |
Neutral |
Moving Averages
|
Day |
SMA |
EMA |
|
5 |
2579.13 |
2572.16 |
|
50 |
2541.57 |
2512.09 |
|
200 |
2356.16 |
2359.80 |
Inference
-
The simple and exponential moving average displays a strong bullish uptrend for the 50- and 200-days period. whereas mild bearish down trending simple moving average signals are displayed during the period of 5 days
-
SMA & EMA Moving Averages Crossovers indicate there are signals of mild bearish to strong bullish signals for the period from 5 - 200 days.
Pivot Levels
|
Standard Pivot Levels of Nestle India Limited as on 29th February, 2024 |
||||||
|
S3 |
S2 |
S1 |
Pivot |
R1 |
R2 |
R3 |
|
2500.95 |
2524.00 |
2560.10 |
2583.15 |
2619.25 |
2642.30 |
2678.40 |
Risk Reward for Swing Trading
Based upon the pivot levels, fundamental and technical evaluation, we can infer that the stock price of Nestle India Limited is overpriced but the ratio analysis intimates that the company possess strong fundamentals, also the technical indicators intimate that the stocks would follow a strong bullish uptrend in forthcoming days.
When applying swing trading strategies, the risk-reward ratio for Nestle India Ltd. determined by pivot levels is calculated as below
A swing trader can make a buy entry at Support Level ‘S1’ Rs.2560.10 with stop loss order at price if crosses below Support Level ‘S1’ at Rs.2560. However, on a risk -reward basis, a trader can make calculative risk of 1:2 ratio, where for a buy entry at Rs.2560.10, he can take a calculative risk of 3%, i.e. Stop loss exit order at Rs.2483.30 and with a reward of 6%, i.e. the trader can set his target profit price as Rs.2713.71
Summary
To conclude, after a thorough analysis of Adani Enterprises Ltd. and Nestle India Ltd., it's evident that both these swing trading stocks exhibit distinct characteristics and offer unique opportunities to be dealt as best stocks to swing trade . Adani Enterprises Ltd. presents a scenario of overpricing and mild bearish to bullish trends based on valuation and profitability analysis, while Nestle India Ltd. demonstrates strong fundamentals and bullish indicators despite being overpriced. With careful consideration of pivot levels, technical and fundamental evaluations, swing traders can formulate strategies to capitalize on potential price movements in both stocks. Effective risk management through stop-loss orders and position sizing is crucial for successful swing trading in these sectors.
Traders can consider ‘Adani Enterprises Ltd.’ and ‘ Nestle India Ltd.’ as swing trading stocks for this week. Novice traders can trade through Orca, the best trading platform in India for beginners.
Frequently Asked Questions
What are the key characteristics of the Metal sector in Nifty?
The Metal sector in Nifty consists of companies engaged in the production of metals such as steel, aluminium, copper, and others. It is highly cyclical, influenced by factors like global economic conditions, commodity prices, and demand-supply dynamics.
What are the key characteristics of the FMCG sector in Nifty?
The FMCG (Fast Moving Consumer Goods) sector in Nifty comprises companies that produce goods with a quick turnover and relatively low cost. It is relatively stable compared to other sectors, as demand for these products remains consistent even during economic downturns.
How does technical analysis contribute to pinpointing entry and exit positions in swing trading?
It relies on historical price and volume data to predict future price trends. Traders employ indicators such as RSI, moving averages, and MACD to determine optimal entry and exit points.For in-depth technical analysis of Stocks, visit Enrich Money.
How does fundamental analysis used in swing trading?
Fundamental analysis is a process of analysing a company's financial health, industry trends, and macroeconomic factors. Traders can use fundamental analysis to identify undervalued stocks with strong growth potential for swing trading. For in depth fundamental analysis of stocks, visit Enrich Money
How do the risk-reward profiles differ between the Metal and FMCG sectors for swing trading?
The Metal sector tends to have higher volatility and therefore potentially higher returns, but it also comes with higher risks due to its sensitivity to external factors like commodity prices and global economic conditions. The FMCG sector, on the other hand, offers lower volatility and lower potential returns, but it is also less risky due to the stable demand for its products.
How can technical analysis help identify entry and exit points for swing trading in these sectors?
For entry points, traders may look for bullish chart patterns, such as a breakout from a resistance level or a moving average crossover.
For exit points, traders may use indicators like the Relative Strength Index (RSI) or Moving Average Convergence Divergence (MACD) to identify overbought or oversold conditions. For in depth technical analysis of Stocks, visit Enrich Money
How can fundamental analysis help identify potential swing trades in these sectors?
For the Metal sector, factors like commodity prices, global demand, and production costs can be crucial.
For the FMCG sector, factors like consumer spending trends, brand strength, and market share can be important. For in depth fundamental analysis of stocks, visit Enrich Money
How can traders manage risk in swing trading using stop-loss and position sizing?
Stop-loss orders are used to limit losses by automatically selling a stock if it reaches a certain price.
Position sizing involves determining the amount of capital to allocate to each trade based on the risk-reward ratio and the trader's risk tolerance.
By using stop-loss orders and proper position sizing, traders can effectively manage risk and protect their capital.
Related Stocks
Disclaimer: This blog is dedicated exclusively for educational purposes. Please note that the securities and investments mentioned here are provided for informative purposes only and should not be construed as recommendations. Kindly ensure thorough research prior to making any investment decisions. Participation in the securities market carries inherent risks, and it's important to carefully review all associated documents before committing to investments. Please be aware that the attainment of investment objectives is not guaranteed. It's important to note that the past performance of securities and instruments does not reliably predict future performance.