Nifty Midcap150 Quality 50 Index: Overview, Sectors, Top Stocks & Returns
Nifty Midcap150 Quality 50 – Overview
Nifty Midcap150 Quality 50 Index contains 50 fundamentally strong midcap stocks which are shortlisted from the larger Nifty Midcap 150. These top 50 midcap quality stocks are shortlisted based on each stock’s financials for five years like Return on Equity, Leverage levels and earnings stability.
Characteristics
Nifty Midcap150 Quality 50 index started its trading session on October 24, 2019, but the index calculation dates back from April 1, 2005, on a base level of 1000 points.
It generally consists of 50 stocks, rebalancing its portfolio every six months (June and December) in order to maintain the most recent quality assessments and market trends.
Weighting Method
Firm representation in the index is calculated by combining their quality rank and free-float market capitalization to balance fundamental strength and market tradability. There is also a Total Returns Index (TRI) variant which includes dividend payments in its performance metric.
Nifty Midcap 150 Quality 50 Uses
A standard for measuring midcap companies with better fundamentals.
Nifty Midcap 150 Quality 50 acts as an underlying index for passive funds, ETFs, and other investment products with an objective of quality midcap exposure.
Sectoral Allocation:
The index has a diversified exposure with high weights in capital goods (19.49%), information technology (15.16%), financial services (12.64%), FMCG (9.44%), and healthcare (8.89%), and has representation across a range of other sectors including chemicals and consumer durables.
|
Industry |
Weightage |
|
Capital Goods |
19.49% |
|
Information Technology |
15.16% |
|
Financial Services |
12.64% |
|
Fast Moving Consumer Goods |
9.44% |
|
Healthcare |
8.89% |
|
Chemicals |
6.99% |
|
Automobile and Auto Components |
4.95% |
|
Consumer Durables |
4.92% |
|
Metals & Mining |
4.46% |
|
Textiles |
4.16% |
|
Oil Gas & Consumable Fuels |
4.03% |
|
Consumer Services |
2.56% |
|
Diversified |
1.45% |
|
Media Entertainment & Publication |
0.80% |
Major Constituents (as of July 31, 2025):
Significant members, by weight of index, are Colgate Palmolive (India) Ltd., HDFC Asset Management Company Ltd., Dixon Technologies, Marico Ltd., Cummins India, Page Industries, Coforge Ltd., Persistent Systems, IRCTC, and Polycab India.
Performance and Risk
Nifty Midcap150 Quality 50 Index performance witnessed a significant 1-year return of 20.3% and an impressive 5-year CAGR of 18.74%, highlighting its ability to deliver consistent growth. Since its launch, the index has consistently registered an annualized return of nearly 17-18%. Short-term observations record a marginal quarterly fall of 1.72%, along with a gain of 0.79% year-to-date which is a characteristic of usual midcap market volatility.
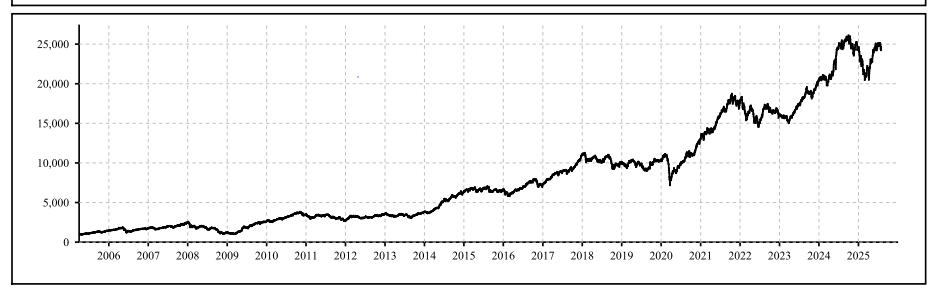
Source - www.niftyindices.com
Nifty Midcap150 Quality 50 Index has moderate volatility with an annualized standard deviation of around 16-17%. Its beta of around 0.81 with respect to Nifty 50 indicates lower sensitivity to overall market moves with some downside while still having growth, along with a very high correlation of 0.92 with the Nifty 50, it tracks the market closely but with better risk-adjusted returns.
Valuation metrics report a premium P/E of 36.74 and P/B of 9.15, illustrating investor faith in the quality of the underlying companies. Dividend yield is reasonable at 1.31%, which shows the choice for reinvestment over dividend distribution.
Top Constituents of Nifty Midcap150 Quality 50 Index
The top stocks of Nifty Midcap150 Quality 50 index have solid market positions, good cash flows, and stable earnings growth, significantly improving the return profile of the index. The index has no overconcentration with the top single-stock weight being less than 5%, allowing risk diversification.
|
Top Stocks |
Weightage |
|
4.56% |
|
|
3.78% |
|
|
3.35% |
|
|
3.18% |
|
|
2.98% |
|
|
2.98% |
|
|
2.88% |
|
|
2.74% |
|
|
2.56% |
|
|
2.54% |
Analysis Of Top 10 Stocks of Nifty Midcap150 Quality 50 Index
|
Name |
Mar Cap Rs.Cr. |
ROE % |
ROCE % |
P/E |
ROE 5Yr % |
ROE 3Yr % |
1Yr return % |
3Yrs return % |
Div Yld % |
CMP / BV |
ROA 12M % |
Debt / Eq |
EPS 12M Rs. |
|
58481.73 |
16.71 |
20.66 |
60.59 |
21.51 |
21.08 |
43.63 |
33.17 |
0.87 |
9.16 |
10.39 |
0.17 |
29.99 |
|
|
62554.95 |
81.19 |
105.34 |
44.89 |
73.2 |
72.39 |
-36.22 |
13.08 |
2.22 |
37.57 |
46.23 |
0.04 |
51.23 |
|
|
108435.73 |
28.15 |
36.32 |
50.87 |
22.61 |
26.27 |
2.63 |
48.33 |
1.32 |
14.36 |
20.85 |
0 |
77.24 |
|
|
102197.94 |
32.92 |
39.81 |
119.1 |
26.96 |
28.1 |
31.36 |
60.98 |
0.03 |
33.8 |
7.34 |
0.22 |
197.39 |
|
|
124666.24 |
32.35 |
43.33 |
47.86 |
28.91 |
29.12 |
31.69 |
39.25 |
1.54 |
15.32 |
30.18 |
0 |
121.85 |
|
|
58004 |
37.16 |
49.03 |
44.37 |
36.82 |
40.37 |
-22.82 |
0.47 |
1.1 |
15.83 |
19.87 |
0.02 |
16.72 |
|
|
94901.33 |
41.34 |
45.16 |
56.86 |
38.11 |
38.65 |
6.99 |
12.51 |
1.44 |
23.81 |
21.01 |
0.14 |
12.88 |
|
|
50925.57 |
48.54 |
59.4 |
66.59 |
45.37 |
44.34 |
8.25 |
-3.06 |
1.97 |
36.19 |
27.38 |
0.19 |
685.62 |
|
|
83986.08 |
24.08 |
30.44 |
55.3 |
22.87 |
24.38 |
8.25 |
43.63 |
0.65 |
13.14 |
16.84 |
0.05 |
97.89 |
|
|
106861.7 |
21.44 |
29.72 |
48.22 |
20.73 |
21.61 |
3.93 |
43.56 |
0.49 |
10.87 |
15.15 |
0.02 |
147.31 |
The top 10 constituents of the Nifty Midcap150 Quality 50 index are analyzed on basis on its historical track records and key financial ratios.
Coforge Ltd.
-
Coforge Limited holds a capitalization of Rs.58,482 crore. With a profitability of 21.5% and 20.7% on 5-year average ROE and ROCE . This signals continuous strong returns on allocated capital. The total earnings return for 1 and 3 years are 43.6% and 33.2% which is impressive . The current P/E of 60.6 which indicates that Coforge Ltd. has outperformed the benchmark and also indicates high future growth. Coforge has limited leverage which in turn supports quality and reduces the risk of refinancing. The dividend distributions are moderate which is in favour of capital reinvestment .
-
Investment Conclusion: Coforge is attractive for growth-based equity market investors who focuses on high-return, low-leverage businesses even though the stocks are overvalued.
Colgate Palmolive (India) Ltd.
-
Colgate holds a market capitalization of Rs.62,555 crore. Colgate leads the industry in its profitability with an excellent ROE and ROCE of 81.2% and 105.3%. Colgate holds its market which is visible through its franchise value and pricing power. Though its recent price movement is negative due to cyclical headwinds or market re-rating , its premium business quality is reflected in its price valuation. It has a strong leverage facility and healthy payouts.
-
Investment Conclusion: Colgate is suitable for income-oriented investors due to its low beta volatility and high quality.
Cummins India Ltd.
-
Cummins with its market capitalization of Rs.1,08,436 crore. Cummins has strong historical returns which is reflected in its ROE and ROCE of 28.2% and 36.3%. Cummins management’s capital discipline adds value to its profitability. Cummins holds a strong historical CAGR though its low performance recently. Cummins dividend payout is consistent.
-
Investment Conclusion: Cummins is suitable as a core investment option in midcaps. Cummins is suitable for sector diversification with consistent high returns with high liquidity.
Dixon Technologies (India) Ltd.
-
Dixon holds a market capitalization of Rs.1,02,198 crore. Dixon holds superior ROCE of 39.8% and average ROE and CAGR of 32.9% and 26.9%. Dixon stocks are over valued which are influenced by market expectations but outpaces its peers in performance in terms of capital growth. Strict leveraging supports capital deployment.
-
Investment Conclusion: Dixon with high volatility exposure to manufacturing-led cycles and high-growth mandates despite over valuation risks.
HDFC Asset Management Company Ltd.
-
HDFC AMC holds a market capitalization of Rs.1,24,666 crore. HDFC AMC maintains a sustained ROE of 32.4% and strong ROCE . HDFC AMC holds strong returns and a CAGR of 28.9%.HDFC AMC has strong payout ability and is almost debt free.
-
Investment Conclusion: HDFC AMC remains the best in class in asset management segment. Its cyclicality and strong compounding characteristics are suitable for quality portfolios.
Indian Railway Catering And Tourism Corporation Ltd. (IRCTC)
-
IRCTC holds a market capitalization of Rs.58,004 crore. IRCTC holds a high ROE and ROCE of 37.2% and 49.0% by leading the sector . Though its recent return performance is unsatisfactory , its overall financial metrics remain strong. IRCTC’s debt is exceptionally very low.
-
Investment Conclusion: IRCTC is a suitable for investors who anticipates sectoral recovery. IRCTC has provided consistent profitability.
Marico Ltd.
-
Marico with a market capitalization of Rs.94,901 crore. Marico has maintained long term value creation for its investors which are reflected in its high ROE and ROCE of 41.3% and 45.2%. Though Marico is overvalued , it holds reliable dividend yield and moderate returns. Marico maintains low leverage and standard exposure being a core FMCG.
-
Investment Conclusion: Marico is suitable for investors targeting consistent, depression proof cash flows with moderate growth prospects.
Page Industries Ltd.
-
Page holds a market capitalization of Rs.50,926 crore. Page holds an exceptional high profitability of ROE of 48.5% and ROCE of 59.4%. Page provides a high dividend yield of 1.97% but overvalued. Page has provided mixed returns and holds minimal leverage.
-
Investment Conclusion: Page Industries is suitable for investors seeking for a high-margin, branded stock.
Persistent Systems Ltd.
-
Persistent holds a market capitalization of Rs.83,986 crore. Persistent has reported consistent growth amidst sector rotation reflected in its ROE and ROCE of 24.1% and 30.4%. Persistent is moderately overvalued, average dividend yield and well-disciplined balance sheet which supports continuous reinvestment.
-
Investment Conclusion: Persistent Systems, a well-positioned sectoral outperformer is suitable for investors interested in IT sector allocations with durable growth and strict capital structure.
Polycab India Ltd.
-
Polycab holds a market capitalization of Rs.1,06,862 crore. Polycab has an average ROE and ROCE of 21.4% and 29.7% with strong capital turnovers. Polycab is almost debt free , with moderate returns.
-
Investment Conclusion: Polycab is suitable for investors seeking stable industrial exposure and compound growth, especially for those favouring low balance sheet risk.
Key Takeaways
The Nifty Midcap150 Quality50 index stock analysis applies a bottom-up, fundamental approach, focusing on return ratios, capital structure, earnings power, and payout policies. Each stocks investment suitability will depend on its growth, income, sector diversification, low-volatility earnings, management quality, operational leverage, and superior historical returns position .
Conclusion
The Nifty Midcap150 Quality 50 Index is meant to identify midcap firms that exhibit superior fundamentals, consistent growth opportunities, and comparatively lower volatility. With support from diversified sector composition, healthy financial ratios, and regular rebalancing, the index presents an investor with a balanced mix of quality, stability, and long-term wealth-generation potential. Its history of providing healthy double-digit CAGR with moderate risk makes it an attractive choice for those looking to harvest midcap growth while protecting against steep market dips.
Unlock midcap growth potential with Enrich Money’s live Nifty Midcap150 Quality 50 Index tracker on ORCA. From top performers like Dixon, Polycab, and HDFC AMC to sector leaders across IT, FMCG, and capital goods, access real-time prices, interactive charts, and in-depth performance data—all in one place. Stay ahead with Enrich Money—your trusted partner for smarter investing in quality midcaps.
Frequently Asked Questions
What is the Nifty Midcap150 Quality 50 Index?
It represents 50 high-quality midcap companies picked from the Nifty Midcap 150 index.
How are the stocks selected?
Selection is based on financial performance over the past five years, considering factors like return on equity (ROE), debt levels, and earnings consistency.
How often is the index rebalanced?
The index undergoes a semi-annual review and rebalancing in June and December.
Which sectors carry the most weight?
Key sector allocations include capital goods, information technology, financials, FMCG, and healthcare.
Why should investors follow this index?
It provides investors with access to fundamentally strong midcaps that combine steady growth with relatively lower market volatility.
Disclaimer: This blog is dedicated exclusively for educational purposes. Please note that the securities and investments mentioned here are provided for informative purposes only and should not be construed as recommendations. Kindly ensure thorough research prior to making any investment decisions. Participation in the securities market carries inherent risks, and it's important to carefully review all associated documents before committing to investments. Please be aware that the attainment of investment objectives is not guaranteed. It's important to note that the past performance of securities and instruments does not reliably predict future performance.