From Basics to Brilliance: Analyzing Top Stock, Comparing, and Unveiling the Top 5 Performers
Imagine a well rooted flourishing tree. It is already deep and strong rooted. The tree had and will thrive in various weather conditions. Similarly, a fundamentally strong stock that has a deep and robust foundation like good financial health, strong management and well performing business operations will obviously stand upright even in times of market fluctuations. Now, how to identify these fundamentally strong stocks in the Indian Stock Market? What are the top 5 fundamentally strong stocks in India? Let’s analyze
Latest Updates on India Limited Nestled Moves In 2025
December 2024:
Financial Performance:
The standalone net profit of Nestlé India for December quarter 2024 was at Rs.696.13 crore, which is up 6.18% over the previous year's profit figure of Rs.655.61 crore. Further, the sales increased by 3.89% at Rs.4,762.13 crore.
Dividend Declaration:
Nestlé India issued a second interim dividend of Rs.14.25 per share for a record date of February 7, 2025, with payment being made on February 27, 2025.
January 2025:
Market Performance
On 31 January 2025, shares of Nestlé India climbed up to as much as 7.6%, to a high of Rs.2,387.45 before closing at Rs.2,313.05, up by 4% for the day. Even with this increase, the company's reported profit of Rs.696.13 crore during the quarter.
February 2025:
Stock Performance:
Nestlé India's shares fell by 1.22% on February 13, 2025, closing at Rs.2,161.25. Nestlé India's trading volume was 93,163 shares, higher than its 50-day average of 79,977 shares.
On February 14, 2025, Nestlé India's shares gained marginally by 0.69%, closing at Rs.2,165.40. Nestlé India's shares were still Rs.611.60 short of their 52-week high at Rs.2,777.00, which was achieved on September 27, 2024.
March 2025:
Market Performance:
On 21st March, 2025, the shares of Nestlé India rose 0.12%, closing at Rs.2,163.85. The volumes of trading were significantly higher than their 50-day average and traded 136,073 shares, which was compared to their typical 79,851 shares.
What makes a Stock to be Fundamentally Strong?
A stock of a company can be considered fundamentally strong only when their business is performing better than other stocks even during the period of downtrend.
How to Identify Fundamentally Strong Stocks?
There are various crucial parameters by which a company needs to be analyzed to identify its strength.
-
Capital – A capital is a company’s initial investment to start and continue its operations on a daily basis. It is simply the lifeline of the business and its expansion. A capital funder will generally possess equity ownership in the company.
-
Debt – A type of fund utilized by a company to meet its short- and long-term liabilities. When the debt is utilized properly it will provide a major return for the company. A debt funder doesn’t not own any ownership with the company but will receive a regular payment of interest.
-
Debt/ Equity Ratio – This ratio indicates the debt of a company in comparison with its assets. Generally, this ratio must be less than 1. A higher D/E ratio indicates that the company’s equity will not be enough to cover its debt.
-
Asset Turnover Ratio - The asset turnover ratio is a financial metric that measures a company's efficiency in utilizing its assets to generate revenue. It is calculated by dividing the company's net sales by its average total assets. A higher asset turnover ratio generally indicates that the company is effectively using its assets to generate sales.
-
Management – The main role of the management team in a company is to achieve the company’s vision and mission through planning, organizing, controlling, leading and staffing. A management team should have good decision making and problem-solving skills.
-
Profitability – A company needs to be profitable to meet its ongoing activities without burdening themselves with debt. Profitability of a company can be analyzed through its Return on Equity (ROE) ratio, Return on Capital Employed (ROCE) ratio and Compounded Annual Growth Rate (CAGR) for a period of 5 years. Generally, a company’s ROE must be high in the short term. Also, Analyze the company's Return on Equity (ROE) by comparing it with industry benchmarks. A stronger alignment between the ROE and Return on Capital Employed (ROCE) indicates healthier financial conditions, signifying a better alignment of interests among stakeholders.
-
Compounded Annual Growth Rate (CAGR%) – For a company to generate value, it must consistently exhibit growth. While acknowledging that even the best companies may experience downturns, maintaining a positive average Compound Annual Growth Rate (CAGR) over time is crucial. The average CAGR serves as a valuable metric for assessing a company's long-term performance. This information proves beneficial when making investment decisions. When discussing growth, we are referring to the fundamental expansion in the top line. Such growth in the top line can stem from either increased volumes or higher prices, contingent upon the market's size and the company's pricing influence. It's essential for higher sales to translate into increased profit growth, as this reflects what shareholders earn after covering all expenses. A comprehensive approach involves examining profit margins under various conditions, including margins from sales, operating margins, gross margins, and more.
-
Promoter Holding’s -The promoters are the controllers of the company by whose idea the company was first established. The promoter’s shareholding should be more than 30% in a company.
-
Sales Growth – A company’s sales growth is calculated quarterly, half yearly and annually. The positive sales growth indicates that the demand of the company’s product or service is increasing. Generally, the company’s sales growth over a period of 5 years should be more than 16%.
-
Price/Earnings to Growth (PEG) Ratio - This ratio is calculated for a company’s traded stock. A PEG ratio of more than 1 indicates that the stock is overvalued and less than 1 indicates that the stock is undervalued.
-
Price to Earnings (P/E) ratio – It is calculated for a stock and it indicates how much an investor is willing to pay to buy per rupees. Its high P/E indicates stock overvaluation and low P/E indicates that the stock’s current price is lower than its earnings.
-
Market Capitalization – Generally market capitalization for a fundamentally strong stock should be more than Rs. 500 crores.
-
Volatility - It is a measure of the stock’s price movements over a period of time. Volatility of about 15% is considered desirable.
-
Net Income – It is the profit a company has recorded post income tax
-
Moat – It is a competitive advantage that shields a company from rivals, helping it maintain market share and profitability. Coined by Warren Buffett, a wide and lasting moat signifies barriers to entry, making it tough for competitors to challenge the company's market position. These advantages can be diverse, such as strong branding, cost efficiency, unique technology, regulatory benefits, or a network effect. The term "moat" suggests the company has established a protective barrier, making it harder for others to compete. Investors often favour companies with a robust moat, indicating a resilient and enduring business model.
Top 5 Fundamentally Strong Stocks in India
The below table provides insights on the financial health, valuation and performance of each stock with which the fundamental strength of the stocks can be ascertained.
|
Stock Name |
Sub Sector |
Market Cap (Rs. in Crores) |
Closing Price in Rs. |
PE Ratio |
Volatility |
Debt To Equity |
Net Income (Rs. in Crores) |
Return On Equity |
|
FMCG - Foods |
2,48,569.36 |
2,578.10 |
103.98 |
17.84 |
11 |
2,390.52 |
108.52 |
|
|
Mining - Coal |
2,35,447.04 |
382.05 |
8.36 |
24.53 |
7.47 |
28,165.19 |
55.32 |
|
|
IT Services & Consulting |
13,43,413.99 |
3,713.05 |
31.87 |
18.15 |
8.43 |
42,147.00 |
46.56 |
|
|
IT Services & Consulting |
6,29,069.69 |
1,519.90 |
26.11 |
23.49 |
10.95 |
24,095.00 |
31.8 |
|
|
FMCG - Tobacco |
5,77,994.95 |
463.30 |
30.12 |
18.46 |
0.44 |
19,191.66 |
29 |
Listed above are top 5 fundamentally robust stocks in the Indian Stock Market as of January 2024. These stocks are part of the Nifty components, chosen regardless of their market capitalization and volatility. The selection criteria involve a positive P/E ratio, a debt-to-equity ratio below 15%, positive net income, and an ROE exceeding 15% and arranged with ROE % high to low.
Investors should consider these interpretations along with their investment preferences and risk tolerance before making any investment decision.
Stock Analysis of Nestle India Limited
FMCG Sector
FMCG products are short shelf-life consumer goods produced in large quantities at low price. This sector is the fourth largest sector in India and has provided employment opportunities to around three million people across the country.
About Nestle India Limited
Nestle's association with India began in 1912 as The NESTLÉ Anglo-Swiss Condensed Milk Company (Export) Limited, trading and selling products. The first factory was established in 1961 following the Indian Government's push for local production. With 9 manufacturing units and 4 branch offices, Nestle has grown its presence, employing over 8000 people. It offers a wide range of products like food, beverages, chocolates and confectioneries, manages brands like Nescafe, Maggi, KitKat, Cerelac, Milkmaid, etc.
Domestic Revenue Contribution (as on October 2023)
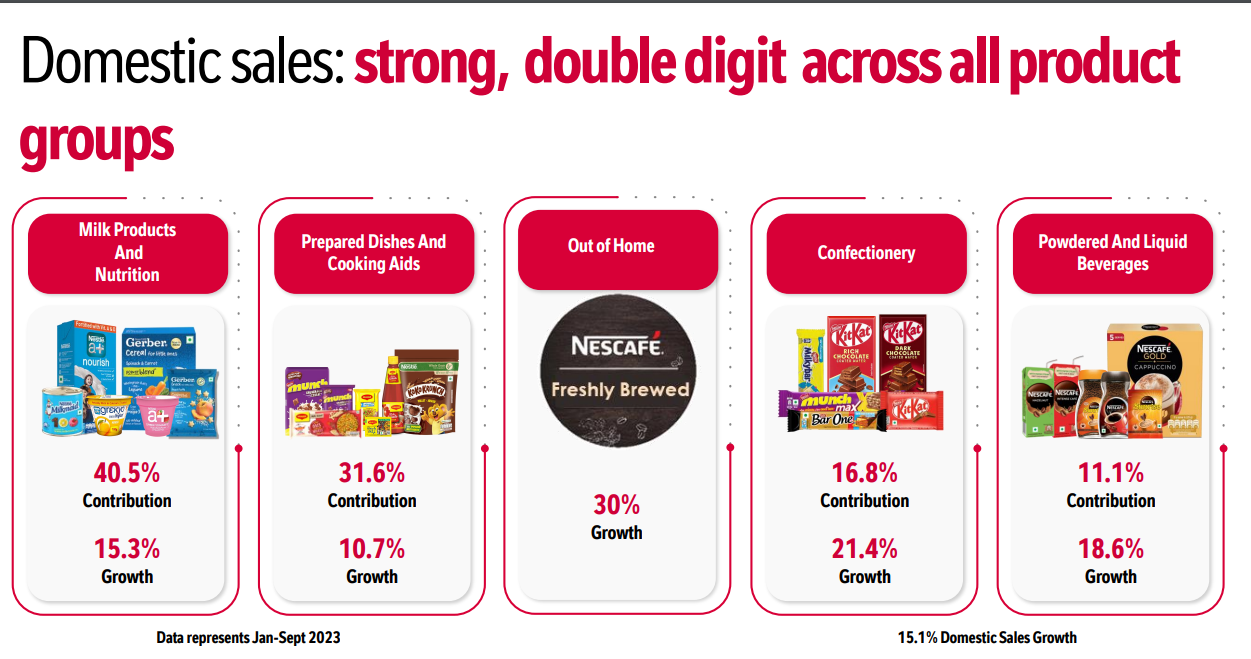
Source: Nestle Investor Presentation
Geographical Presence
As of October 2023, the company boasts a network of over 2,000 distributors spanning 14 states and reaching 7,405 towns. The accompanying image illustrates the decade-long domestic sales growth of Nestle India.
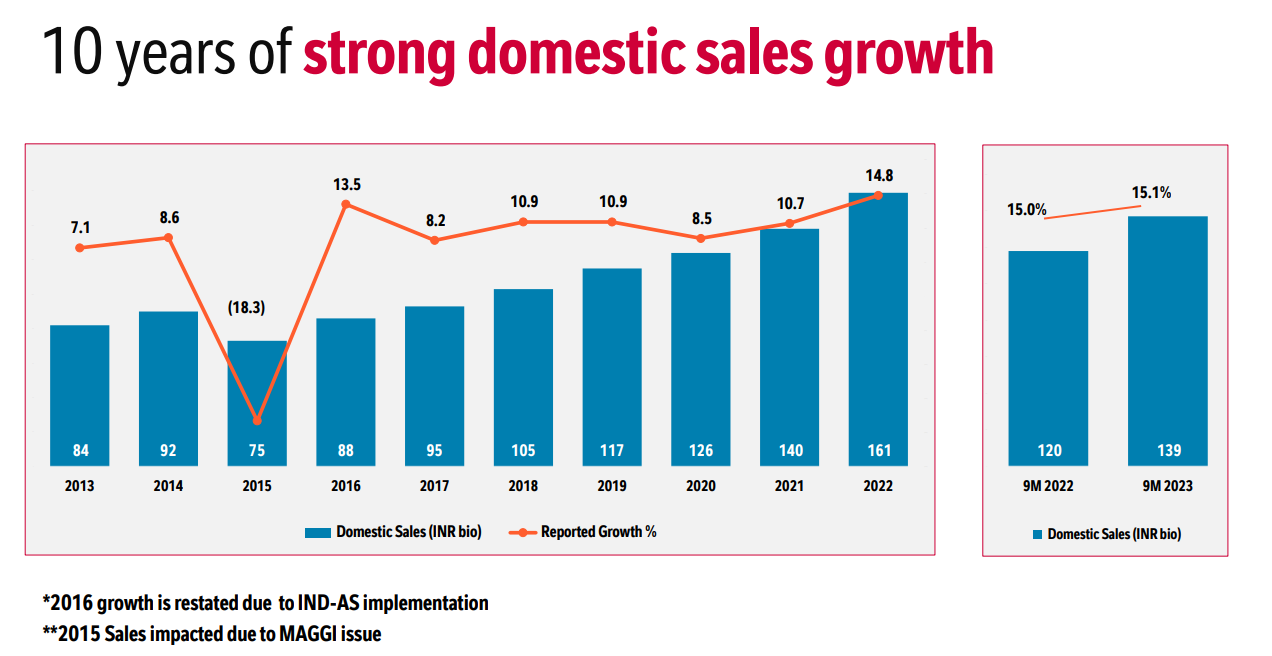
Source: Nestle Investors Presentation
Fundamental Analysis
The company follows a calendar year financial cycle, commencing on January 1st to December 31st each year.
Revenue and Net Profit After Tax:
|
Year |
Revenue (Rs in Crores) |
PAT (Rs in Crores) |
|
2018 |
11,216 |
1,606 |
|
2019 |
12,295 |
1,968 |
|
2020 |
13,290 |
2,082 |
|
2021 |
14,664 |
2,118 |
|
2022 |
16,789 |
2,390 |
|
5 Year CAGR Growth |
10.61% |
10.45% |
The company's financial statement highlights a growth in revenue, rising from Rs.11,216 Crores in FY18 to Rs.16,789 Crores in FY22. This equates to a 4-year Compound Annual Growth Rate (CAGR) of 10.61% for the company's revenue.
In tandem with the revenue increase, the net profits of the company have also seen an uptick, climbing from Rs.1,606 Crores to Rs.2,390 Crores. This results in a CAGR of 10.45% for the company's net profit over the past five financial years.
Margin Analysis
|
Year |
Operating Profit Margin % |
Net Profit Margin % |
|
2018 |
21% |
14.30% |
|
2019 |
21.10% |
16.00% |
|
2020 |
21.70% |
15.70% |
|
2021 |
22% |
14.40% |
|
2022 |
20% |
14.20% |
Over the past five fiscal years, the company consistently maintained an operating margin between 20% and 22%, while the net profit margins remained steady within the range of 14% to 16%. This stability in margins, despite growing revenues and profits, indicates effective control over expenditures.
Ratios on Return (ROE & ROCE)
|
Year |
ROE% |
RoCE % |
|
2018 |
45% |
70.93% |
|
2019 |
70.39% |
98.67% |
|
2020 |
105.76% |
147.88% |
|
2021 |
107% |
151.64% |
|
2022 |
109% |
152.61 |
The company's return ratios reflect a positive outlook on its performance. Over the last five years, including the year of Covid-19, both RoE and RoCE have witnessed an increase. In FY22, the company reported a RoE of 108.52% and a RoCE of 152.61%. These ratios signify favourable returns to shareholders and efficient utilization of resources.
Debt & Interest Coverage Ratio
|
Year |
Debt to Equity Ratios |
Interest Coverage Ratios |
|
2018 |
0.01 |
22.7 |
|
2019 |
0.03 |
21.71 |
|
2020 |
0.02 |
18.13 |
|
2021 |
0.02 |
15.17 |
|
2022 |
0.01 |
22.06 |
Examining the company's leverage, it has sustained a debt-to-equity ratio below 0.03 for the past five years. This signifies the company operates with minimal financial pressure, relying less on borrowed capital for its business activities and growth.
The low debt allows the company to retain more revenue, avoiding significant obligations for debt repayment and interest. This has led to a consistently healthy interest coverage ratio, with FY23 reporting a ratio of 22.06. This indicates the company generated ample gross profits, covering its interest expenses 22 times.
Moreover, the low debt position enhances the company's capacity to secure additional funds, facilitating further expansion and advancement in its business activities
Future Plans
Nestlé India is set to invest Rs.4,200 crore ($564 million) by 2025 to expand its manufacturing capacity for noodles, coffee, and chocolates, addressing the demand for both mass and premium products. The company focuses on market expansion in small towns and villages through its RURBAN strategy, introducing localized products. NESmitra, a customer ordering app, is being piloted in RURBAN markets to enhance retailer-distributor connections.
With an increased emphasis on innovation, Nestlé has 30 projects in the pipeline, diversifying its food product range. The company is actively promoting millets as an eco-friendly food option and has doubled its spending on sustainability in dairy, plastics, and sourcing practices.
Stock Split
In October 2023, the board of directors endorsed the subdivision/splitting of every fully paid-up equity share with a face value of Rs 10 into 10 equity shares, each with a face value of Re 1. This is achieved through the modification of the capital clause in the Company's Memorandum of Association.
Key Metrics
|
Particulars |
Figures |
Particulars |
Figures |
|
CMP |
Rs.2,48,569.36 million |
Interim Dividend |
Rs.140 |
|
EPS |
308.16 |
Stock P/E |
103.98 |
|
RoCE (%) |
152.61% |
RoE (%) |
108.52% |
|
Promoters Holding |
62.76% |
Current Ratio |
1.13 |
|
Debt to Equity |
11 |
Price to Book Value |
60.36 |
|
Net Profit Margin (%) |
14.20% |
Operating Profit Margin (%) |
20% |
|
Volatility vs Nifty |
1.66 times of Nifty |
Total Liabilities |
Rs.6519.57 crores |
|
Capital Expenditure |
Rs.549.92 crores |
Total Assets |
Rs. 8978.74 crores |
|
Dividend Yield |
Rs.0.98 % |
Volatility |
17.84 |
Here is a list of 15 Fundamentally strong stocks in Indian Stock Maarket as of January 2024 .
|
S.no |
Stock Name |
Sub Sector |
Market Cap (Rs. in Crores) |
Closing Price in Rs. |
PE Ratio |
Volatility |
Debt To Equity (%) |
Net Income (Rs. in Crores) |
Return On Equity (%) |
Volatility vs. Nifty |
|
1 |
FMCG - Foods |
248,569.36 |
2,578.10 |
103.98 |
17.84 |
11 |
2,390.52 |
108.52 |
1.66 |
|
|
2 |
Mining - Coal |
235,447.04 |
382.05 |
8.36 |
24.53 |
7.47 |
28,165.19 |
55.32 |
2.29 |
|
|
3 |
IT Services & Consulting |
1,343,413.99 |
3,713.05 |
31.87 |
18.15 |
8.43 |
42,147.00 |
46.56 |
1.69 |
|
|
4 |
IT Services & Consulting |
629,069.69 |
1,519.90 |
26.11 |
23.49 |
10.95 |
24,095.00 |
31.8 |
2.19 |
|
|
5 |
FMCG - Tobacco |
577,994.95 |
463.30 |
30.12 |
18.46 |
0.44 |
19,191.66 |
29 |
1.72 |
|
|
6 |
IT Services & Consulting |
176,138.46 |
5,947.50 |
39.96 |
25.03 |
2.13 |
4,408.30 |
28.54 |
2.33 |
|
|
7 |
Paints |
315,157.05 |
3,286.85 |
76.75 |
17.16 |
11.75 |
4,106.45 |
26.8 |
1.6 |
|
|
8 |
IT Services & Consulting |
404,046.72 |
1,492.10 |
27.21 |
20.73 |
7.33 |
14,851.00 |
23.31 |
1.93 |
|
|
9 |
Pharmaceuticals |
96,364.97 |
5,787.20 |
21.38 |
18.69 |
5.79 |
4,507.30 |
21.21 |
1.74 |
|
|
10 |
Trucks & Buses |
105,199.60 |
3,842.55 |
36.1 |
24.08 |
1.92 |
2,913.94 |
21.12 |
2.25 |
|
|
11 |
Two Wheelers |
199,747.92 |
7,053.75 |
32.96 |
22.81 |
0.42 |
6,060.21 |
20.47 |
2.13 |
|
|
12 |
FMCG - Household Products |
605,583.65 |
2,577.40 |
59.84 |
16.13 |
2.41 |
10,120.00 |
20.32 |
1.5 |
|
|
13 |
IT Services & Consulting |
121,132.24 |
1,240.90 |
25.07 |
25.22 |
9.65 |
4,831.30 |
17.32 |
2.35 |
|
|
14 |
Two Wheelers |
82,714.30 |
4,138.05 |
29.44 |
23.64 |
3.38 |
2,809.96 |
17.15 |
2.21 |
|
|
15 |
Pharmaceuticals |
317, 875.89 |
1,324.85 |
37.51 |
16.08 |
11.61 |
8,473.58 |
15.35 |
1.5 |
**These stocks are from Nifty component which are selected irrespective of their market capitalization and volatility . The stocks are filtered based on positive P/E ratio, Debt to Equity % to be less than 15. Net Income to be positive and ROE % to be more than 15%.
Conclusion
Nestle India has experienced remarkable stock growth since its listing, registering an impressive 865% surge, with the stock price reaching Rs. 2557.20 as of November 20, 2023. The recent decision by the board of directors to approve the company's first-ever stock split, employing a 1:10 ratio, is a noteworthy development. This strategic move not only increases the number of shares but also substantially reduces the share price, making it more accessible for retail investors. By aiming to boost market liquidity through increased trading volume, this initiative holds the potential to benefit both investors and the company in the evolving financial landscape
Frequently Asked Questions
How to Invest in Fundamentally Strong stocks?
One of India's best platforms to invest in fundamentally strong stocks is through Enrich Money. Open a free demat and trading account with Enrich Money and start trading. Here, you can get analysis report of a stock, analyzed both technically and fundamentally
Importance of Fundamental Analysis of a Stock?
Fundamental analysis is crucial as it assesses a stock's intrinsic value based on financial health, earnings, and market conditions. It aids investors in making informed decisions by gauging the company's long-term viability and growth potential. Understanding fundamentals provides a solid foundation for navigating the complexities of the stock market.
Where can I Buy Fundamentally Strong Stocks?
Selecting stocks based on strong fundamentals is an easier process with Enrich Money, saving you time and effort. With the Orca app, you have a unified platform to filter, research, and execute buy orders for stocks.
What three components does fundamental analysis encompass?
Industry analysis, company analysis, and economic analysis are essential aspects that require in-depth examination when assessing stocks.
Can stocks with strong fundamentals endure inflation?
Stocks with robust fundamentals stand a chance of weathering inflation due to their solid financial footing. Nonetheless, it's crucial to acknowledge that stock market investments carry inherent risks, and maintaining a diversified investment portfolio is advisable.
Related Stocks
Check our ORCA app to analyze Nestle stocks' performance:
Nestle India Ltd Share Price Today
Nestle India Technical Analysis
Nestle India Financial Statements
Nestle India Shareholding Pattern
Nestle India Latest Corporate News
Nestle India Stock/Company Overview
Related Stocks
Disclaimer: This blog is dedicated exclusively for educational purposes. Please note that the securities and investments mentioned here are provided for informative purposes only and should not be construed as recommendations. Kindly ensure thorough research prior to making any investment decisions. Participation in the securities market carries inherent risks, and it's important to carefully review all associated documents before committing to investments. Please be aware that the attainment of investment objectives is not guaranteed. It's important to note that the past performance of securities and instruments does not reliably predict future performance.