Best Indicator for Intraday Trading in India 2025

Introduction
In the fast-paced world of day trading, having the best indicator for intraday trading can significantly improve your accuracy and timing. These indicators serve as essential tools for understanding market momentum, price trends, and volatility—all in real time. Whether you're a beginner or an experienced trader, choosing the best technical indicators for day trading can help you make smarter decisions in shorter timeframes.
This article explores the top 6 intraday trading indicators, each known for its reliability and efficiency in the Indian stock market.
Why Technical Indicators Matter in Intraday Trading
Intraday traders operate on tight timeframes and thin margins. With trades often lasting just minutes or hours, the technical indicators for day trading play a critical role in minimizing guesswork. Such tools are designed to make sense of market volatility, highlighting key moments when trends may shift or breakouts are likely.
How Indicators Help Improve Accuracy and Timing
While many tools claim to be the best indicator for intraday, not all work well in every market condition. The key is to use indicators that align with your strategy—momentum-based, trend-following, or volatility-driven—and combine them to confirm trade signals.
Comprehensive List of the Best Indicators for intraday
While there are dozens of technical indicators available, only a handful consistently stand out in fast-paced intraday environments. Below, we focus on the 16 most effective tools traders rely on in 2025.
-
Moving Average Convergence Divergence (MACD)
-
Average Directional Index (ADX)
-
Relative Strength Index (RSI)
-
Exponential Moving Average (EMA)
-
Rate of Change (ROC)
-
Simple Moving Average (SMA)
-
Parabolic SAR
-
On-Balance Volume (OBV)
-
Volume Price Trend (VPT) Indicator
-
Bollinger Bands
-
Average True Range (ATR)
-
Aroon Oscillator
-
Heikin Ashi
-
Stochastic RSI
-
Stochastic Oscillator
-
KST (Know Sure Thing) Indicator
Top 6 Intraday Trading Indicators Explained
1. Relative Strength Index (RSI)
The Relative Strength Index (RSI) is often considered the best indicator for intraday trading by many technical analysts. Developed by J. Welles Wilder, RSI is a momentum oscillator that tracks the speed and magnitude of recent price changes, plotted on a scale of 0 to 100. RSI assists traders in spotting when a stock may be trading at extreme levels. A reading above 70 often indicates overbought conditions and a possible price pullback, while a value below 30 suggests the asset could be oversold and primed for a rebound.
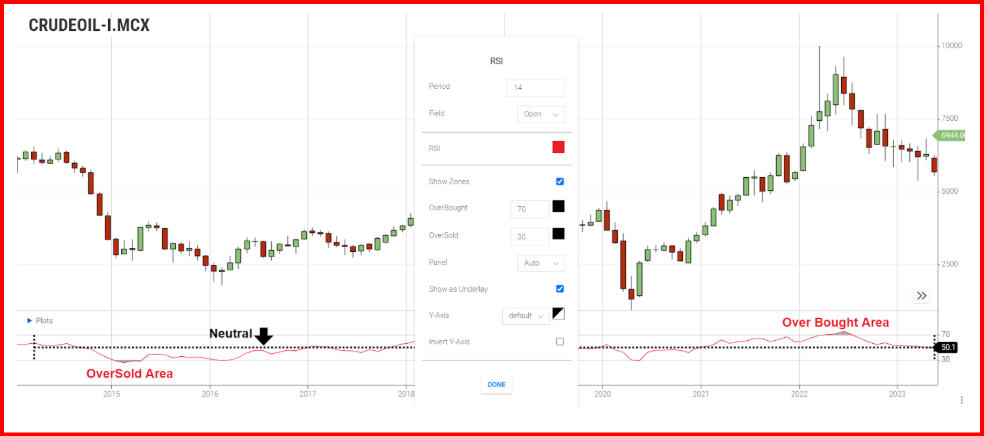
Calculated using the average gains and losses over a standard 14-period timeframe, RSI provides insight into the strength behind a price trend. For those engaged in quick, high-volume trades, RSI remains one of the best indicator for intraday setups, especially when used to time entry and exit points during volatile market sessions.
2. Moving Average Convergence Divergence (MACD)
MACD (Moving Average Convergence Divergence) is considered by many traders as the best indicator for intraday strategies, especially in momentum-based setups.MACD is formed by subtracting the 26-period EMA from the 12-period EMA of a stock’s price. A separate 9-period EMA, known as the signal line, is then applied to this result to help identify entry and exit points.
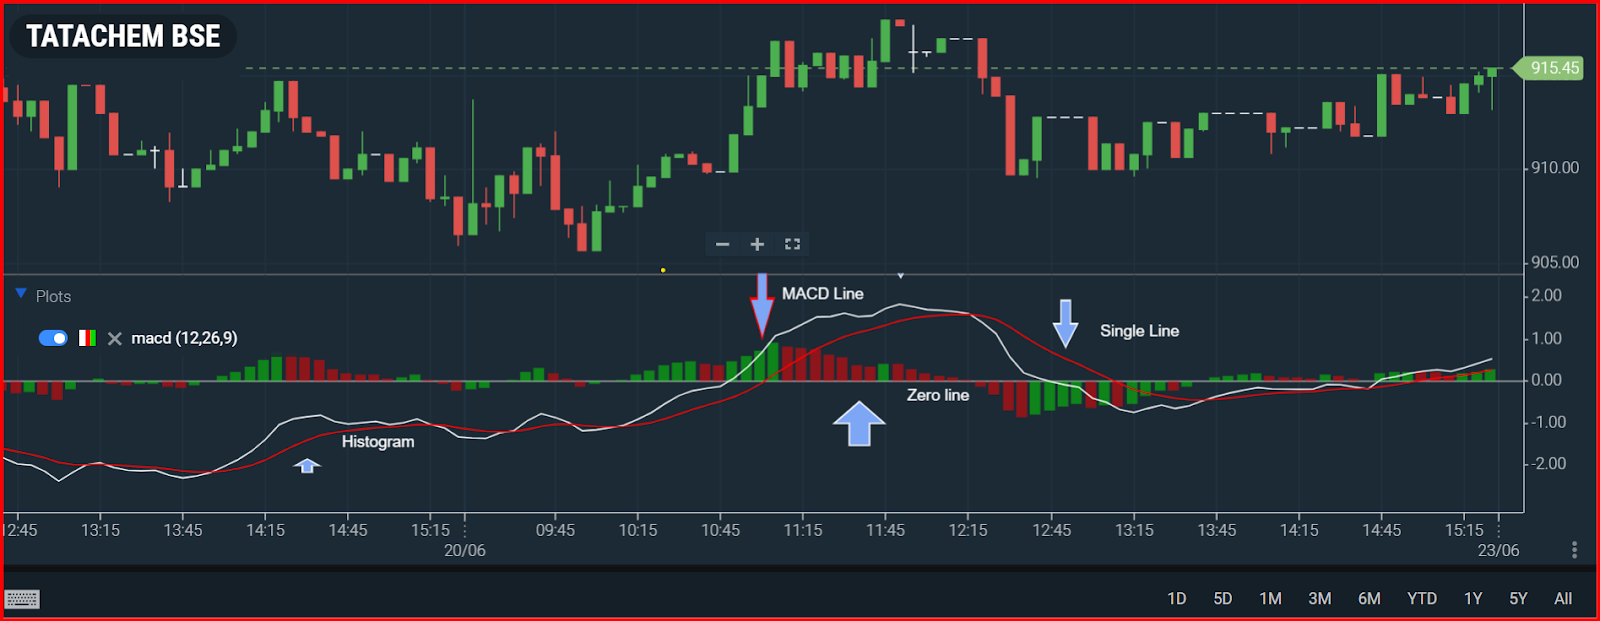
A crossover of the MACD line above the signal line suggests increasing bullish momentum, often seen as a buying cue. A drop of the MACD below the signal line often indicates bearish momentum, hinting at a potential time to sell. This indicator is widely favored by intraday traders in India for its ability to highlight key momentum shifts and improve trade timing during trending markets.
Overall, MACD stands out among the top technical indicators for day trading, offering a clear visual cue for spotting trend direction and strength in real time.
3. Volume Weighted Average Price (VWAP)
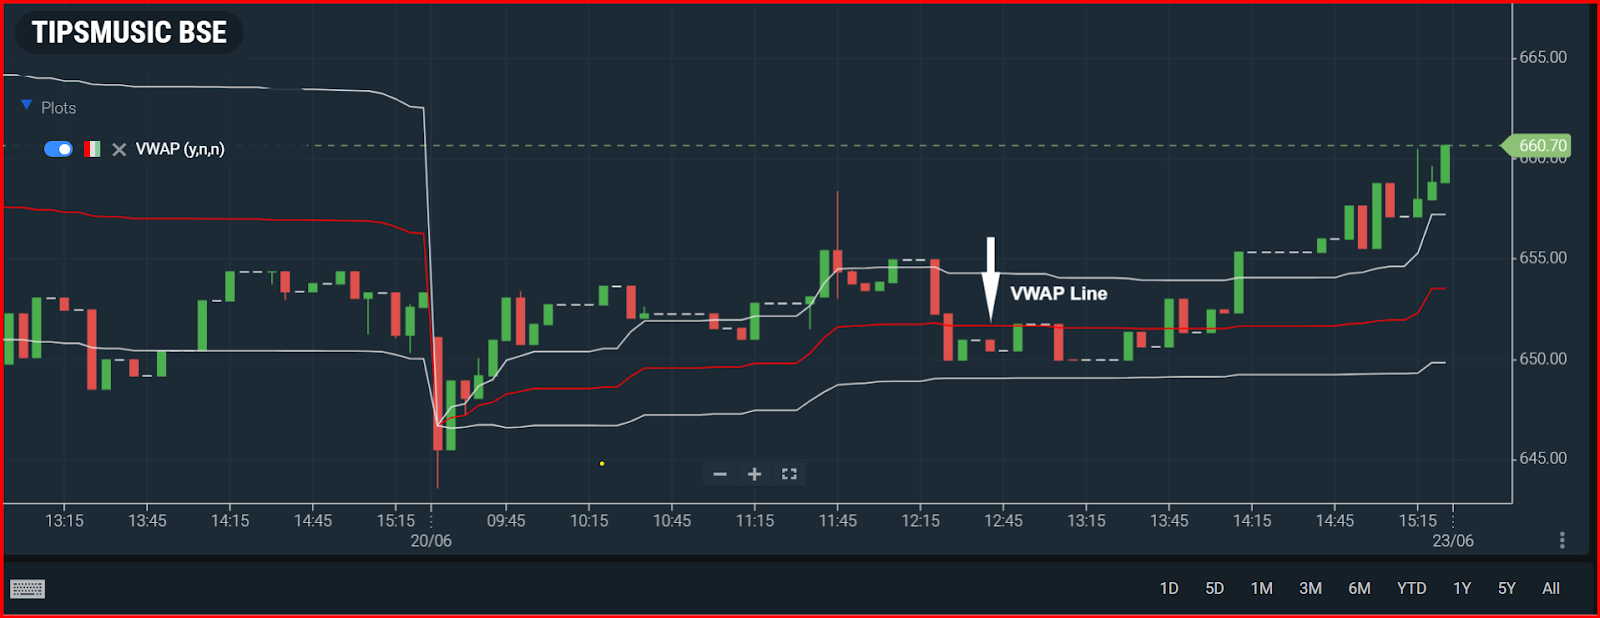
VWAP represents the day's average trading price of a stock, adjusted according to the volume of each trade. Though it may look like Bollinger Bands when bands are enabled, its function is different—only the middle VWAP line is essential.
When the stock price stays above the VWAP line, it indicates bullish market sentiment. A price below VWAP, on the other hand, reflects bearish behavior.VWAP helps intraday traders gauge whether a stock is trading above or below its average value for the day, which is why it’s widely relied on by intraday traders.
4. Bollinger Bands
Bollinger Bands are a popular technical indicator for day trading, developed by John Bollinger to measure price volatility. At the center of Bollinger Bands lies a 20-day simple moving average, with two boundary lines placed two standard deviations above and below this midpoint.Their width adjusts dynamically, reflecting market volatility.
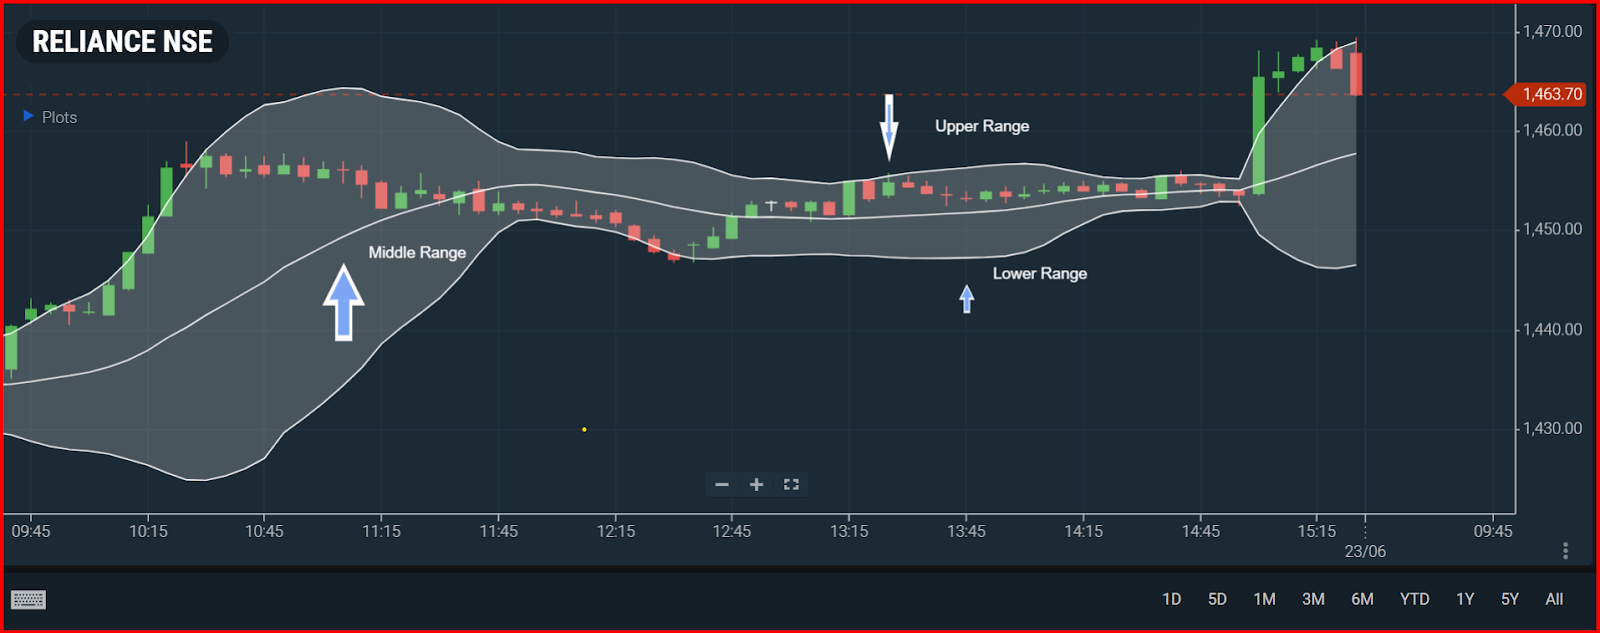
Intraday traders often use Bollinger Bands to identify potential buy and sell opportunities. When the price touches the upper band, it may indicate an overbought condition, signaling a possible sell. A price move toward the lower band may suggest the stock is oversold, potentially signaling a buying opportunity. This constant price movement within the bands helps traders pinpoint entry and exit points, making Bollinger Bands one of the best indicator for intraday.
5. Average Directional Index (ADX)
The Average Directional Index (ADX) helps identify whether a market is trending and how strong that trend is. ADX values are quantified on a spectrum that spans from 0 up to 100, indicating the strength of a trend. Readings above 25 typically point to a strong trend, while values under 20 suggest the market is flat or lacking clear direction.
It includes two supporting lines:
-
+DI (Positive Directional Indicator): measures upward movement.
-
–DI (Negative Directional Indicator): measures downward movement.
A bullish trend is suggested when the +DI line crosses above the –DI line, while a bearish trend is indicated when –DI moves above +DI. Together, these lines help traders determine both trend direction and strength, making ADX a valuable technical indicator for day trading.
6. Stochastic Oscillator
The Stochastic Oscillator is a momentum-driven tool used in intraday trading to detect when a stock may be overbought or oversold within a specific timeframe. It compares a stock’s closing price to its price range over a set period, based on the idea that prices close near the high in uptrends and near the low in downtrends.
It has two main components:
-
%K line: shows the current price position.
-
%D line: a 3-period moving average of the %K line for smoother signals.
The oscillator ranges from 0 to 100:
-
Above 80: overbought zone.
-
Below 20: oversold zone.
-
%K crossing above %D signals potential bullish momentum.
-
A bearish signal occurs when %K crosses below %D.
This makes the Stochastic Oscillator a useful tool for spotting momentum shifts and short-term trade setups.
How to Combine Indicators for Better Accuracy
-
Pairing Momentum and Trend Indicators
Combining a momentum indicator like RSI with a trend-following one like MACD often provides more reliable signals than using any single best indicator for intraday in isolation.
-
Avoiding Signal Conflicts and False Entries
Too many indicators can clutter your chart and lead to confusion. Stick to a select group of indicators that align with your trading approach and work well together.
Tips for Using Intraday Indicators Effectively
-
Stick to One Time Frame for Clarity
Don’t jump across time frames mid-trade. Choose a primary chart (like 5-min or 15-min) and be consistent for better signal accuracy.
-
Don’t Ignore Volume and Price Action
Indicators are helpful, but raw price and volume data still offer unmatched insight. Use indicators as support tools—not replacements.
-
Practice on Demo Before Live Trades
Before applying any technical indicators for day trading in real-time, test them through demo platforms or backtesting tools.
Why These Indicators Matter More in 2025
In 2025, intraday volatility in the Indian stock market is likely to rise, driven by growing F&O activity and the expanding influence of algorithmic trading. With tighter margins and faster trend shifts, traders must rely on responsive indicators like RSI, VWAP, and MACD to stay competitive.
Final Thoughts
Finding the best indicator for intraday trading in India isn’t about picking the most popular tool—it’s about choosing what aligns with your strategy and risk tolerance. Whether it’s momentum-based like RSI, trend-focused like MACD and ADX, or volume-driven like VWAP, using a combination of indicators can significantly improve your intraday performance.
Stay consistent, avoid overtrading, and never underestimate the power of discipline. With the right tools and mindset, you’ll be better equipped to navigate the volatility of intraday markets in 2025.
For more hands-on experience, consider platforms like Enrich Money that offer charting tools and backtesting features—ideal for refining your indicator-based strategies.
Frequently Asked Questions
-
What are the top 5 indicators for intraday trading?
Bollinger Bands, MACD, RSI, EMA, and Volume—these tools help traders track trends, momentum, and volatility in real time.
-
Why are intraday trading indicators important?
They provide real-time data on price movement and trend strength, helping traders make quick, informed decisions.
-
Are intraday trading indicators reliable?
These tools prove effective when combined with a solid trading plan and proper risk control. No indicator is 100% accurate alone.
-
What is the best indicator for intraday with an example?
MACD is among the best indicator for intraday. Example: A bullish crossover signals a potential buy.
-
Are there 100% accurate intraday indicators?
No. Even the best indicator for intraday trading can fail. Use multiple tools and manage risk smartly.
Disclaimer: This blog is dedicated exclusively for educational purposes. Please note that the securities and investments mentioned here are provided for informative purposes only and should not be construed as recommendations. Kindly ensure thorough research prior to making any investment decisions. Participation in the securities market carries inherent risks, and it's important to carefully review all associated documents before committing to investments. Please be aware that the attainment of investment objectives is not guaranteed. It's important to note that the past performance of securities and instruments does not reliably predict future performance.