Investment in Stock Market at Orca
Investing shouldn’t be scary. We make it a walk in the park for all.

, , , ,
What is Equity and Equity Trading?
Equity is the value of shares issued by the company to raise money by sharing a part of ownership. Investing in equity is the oldest form of investment. Companies issue shares through public announcements in newspapers or other media. Investors can be individuals or institutions or companies. Here the investor becomes a part of the company’s ownership by paying the share value. The unit of ownership is measured by the number of shares owned by the investor. As a return the profit is shared as dividend. Equity trading is the activity related to investing, buying, and selling equity to earn gains or profits. It involves all the techniques that attempt to increase the chances of income through equities. Enrich money provides you the quickest and uncompromised services with different brokerage plans and advanced technical research reports.
Smart And Quick Trading With
Enrich Money Equity Trading

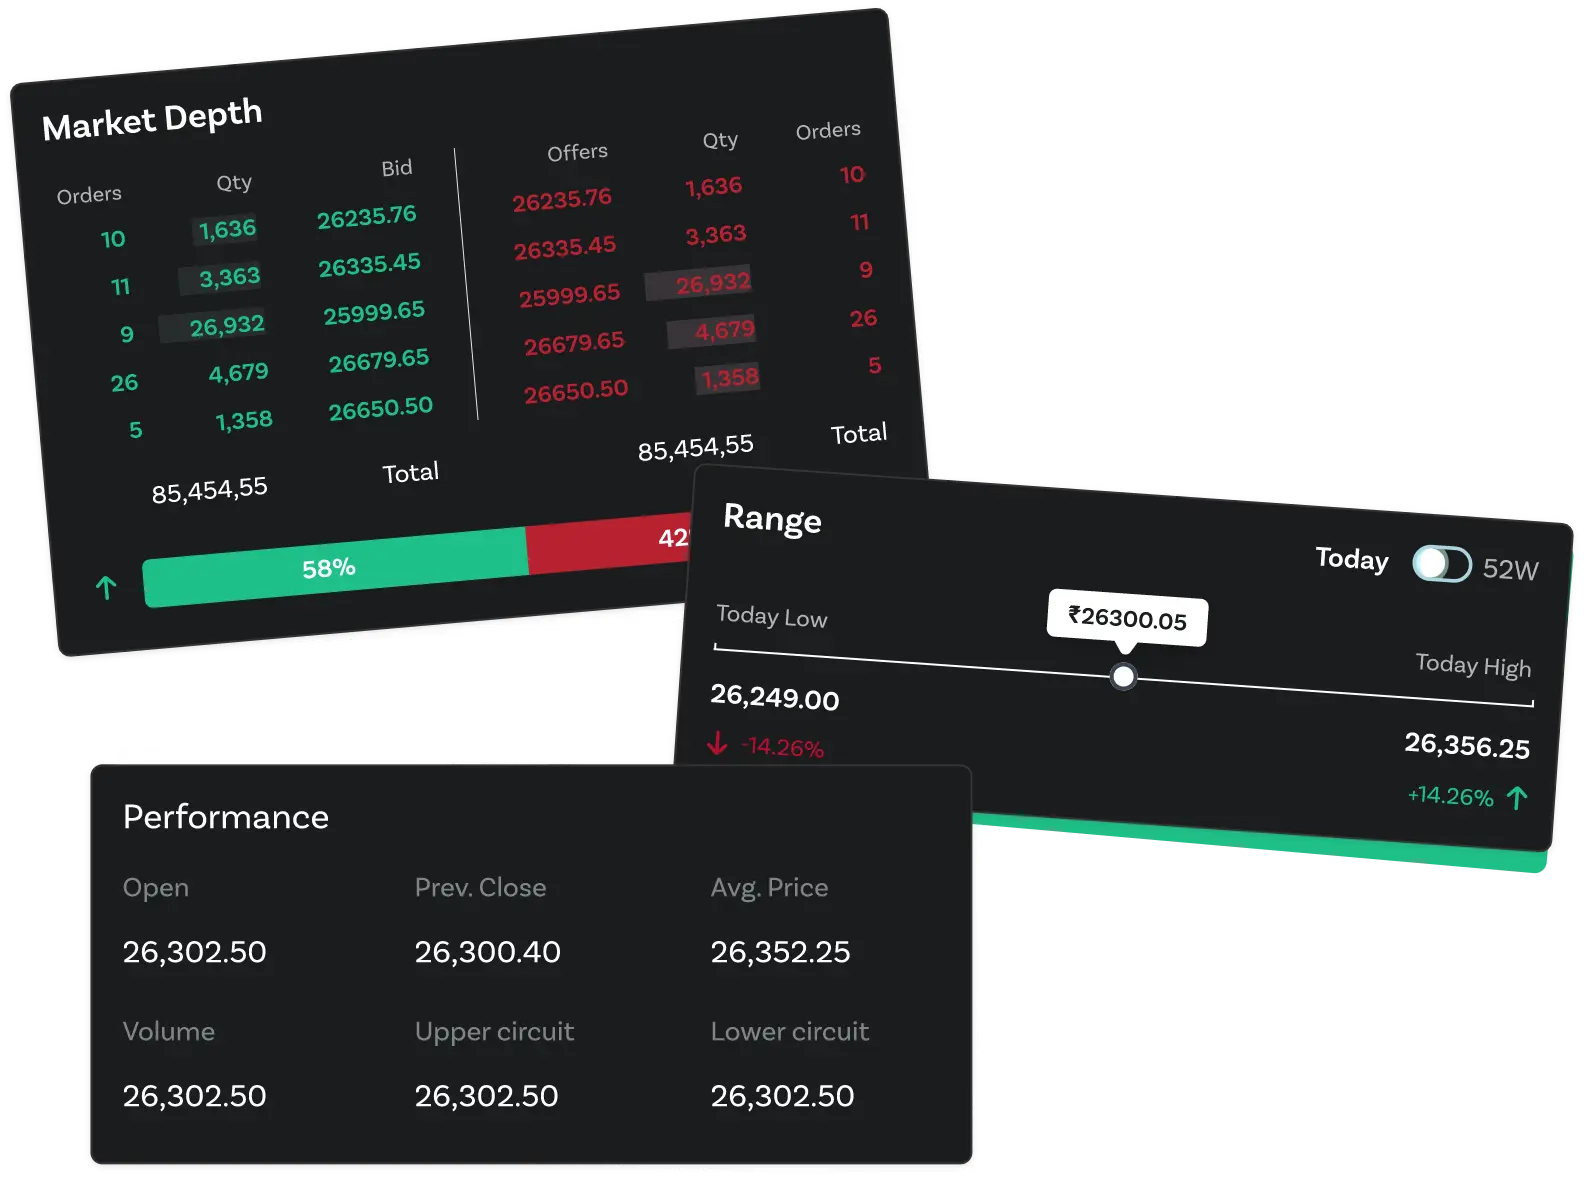
Live Levels
Live levels for Equity FAO, Cash and Commodity

Increased trading potential with Brokerage Calculator

Customer Care
Support at your fingertips. We’re here to help.

Research Report
Insights to power your investments.
Powerful and highly customizable
analysis tools
Analyse your way through Stock Market & Mutual Funds
With Orca's comprehensive analysis, you can gain a competitive edge and make data-driven investment decisions with confidence.





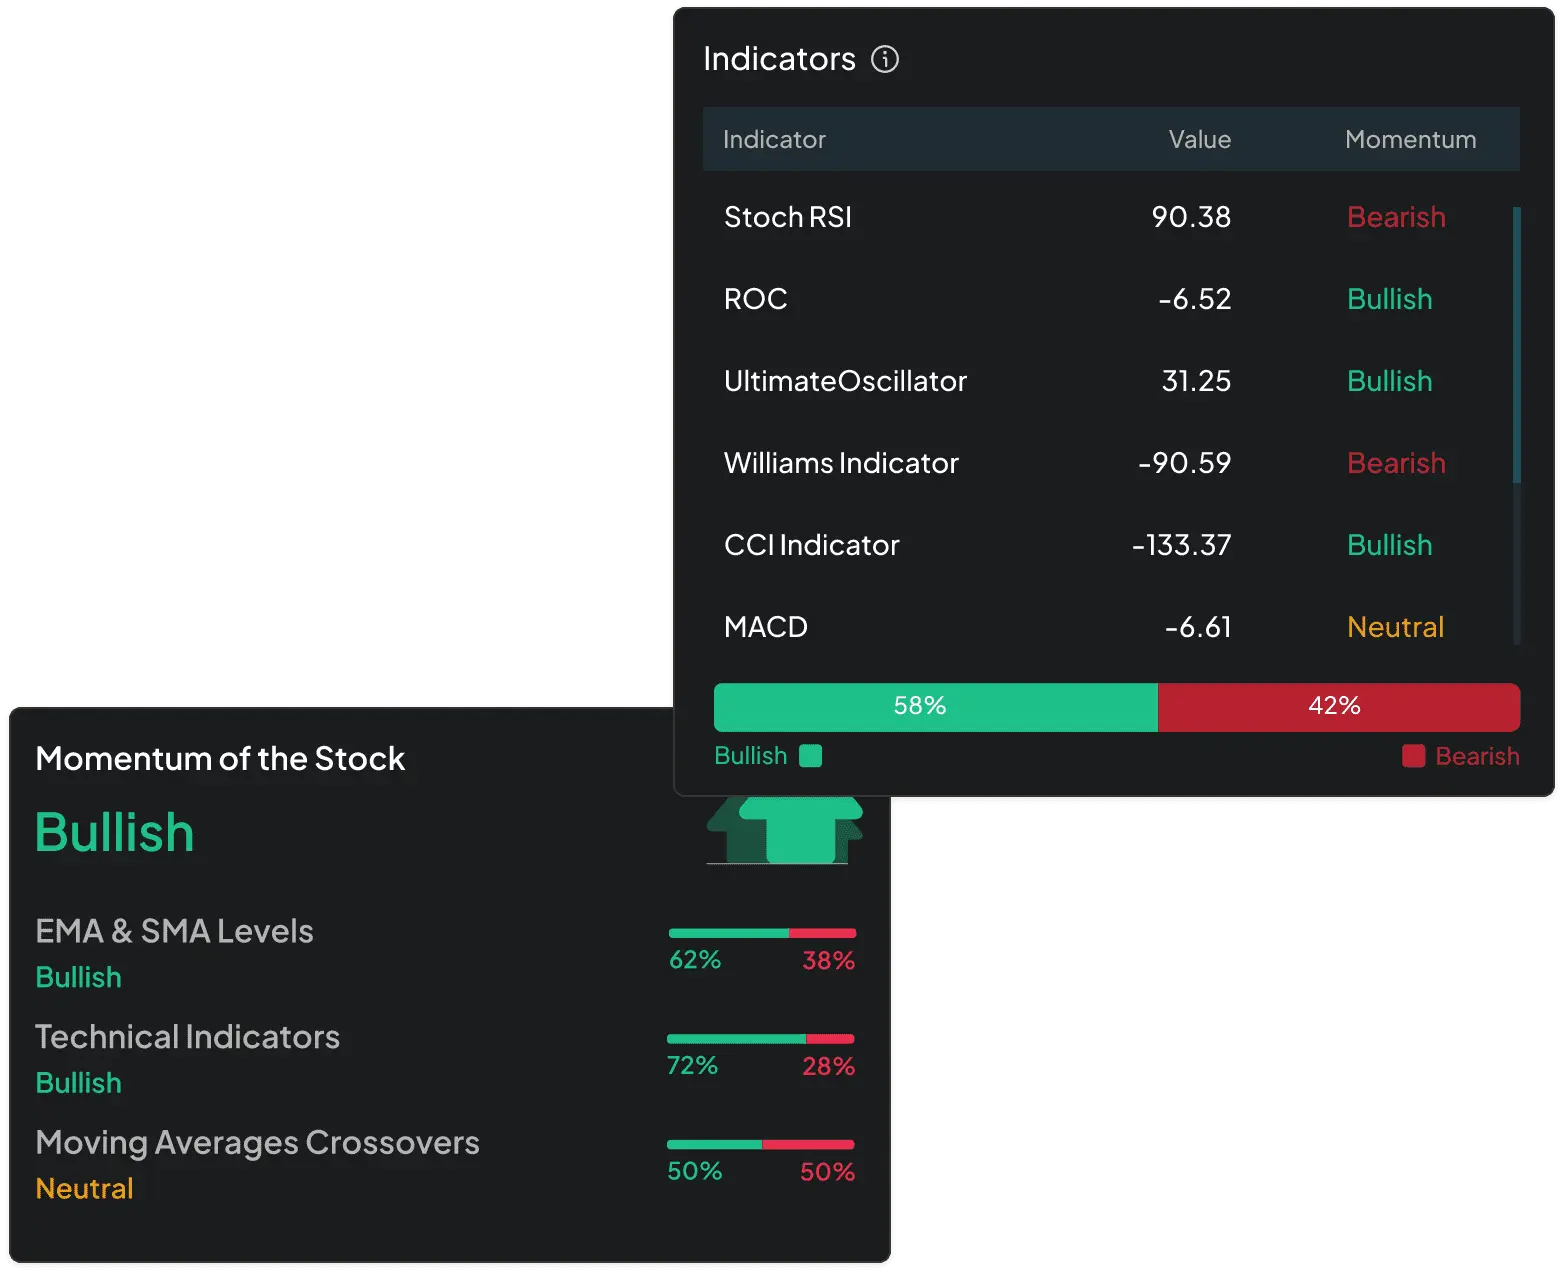
Key performance indicators of Technical analysis
With Orca, you can customize your analysis, overlay multiple indicators, and apply different timeframes to suit your trading style.
What are Equity Investments, and How to Invest?
Investing in the stock market by purchasing a company’s shares is called Equity investment. There are two ways to invest. One is to buy stocks directly, and the other is mutual funds. A trading account and a Demat are essential to invest in equity.
Types of Stock Trading
Day Trade
Grow your money! Invest with Enrich’s experts. Skip the hassle, relax, let them handle it.
Micro Trade
This is a part of intra-day trading. It is a process of earning small profits from dozens to hundreds on the same day. There are chances of loss in a transaction. This is called scalping and differs from day trade because the holding period is less comparatively.
Swing Trade
The investor tries to maximize the profit potential by understanding the trends and patterns. The time period ranges from one to seven days.
Momentum Trade
The investor judges the purchase and sale action by upwards or downwards momentum. If the prices are going up, there is a sales action and purchase otherwise.
Get Started with Orca
Open a Demat account or download the Orca app from Google Play or the App Store.