Webinar On - {{item.WebinarName}} {{item.Date}} Book Now
ORCAPRO
Offers in-depth technical and fundamental analysis that helps investors to analyse any stocks within minutes.
Get Started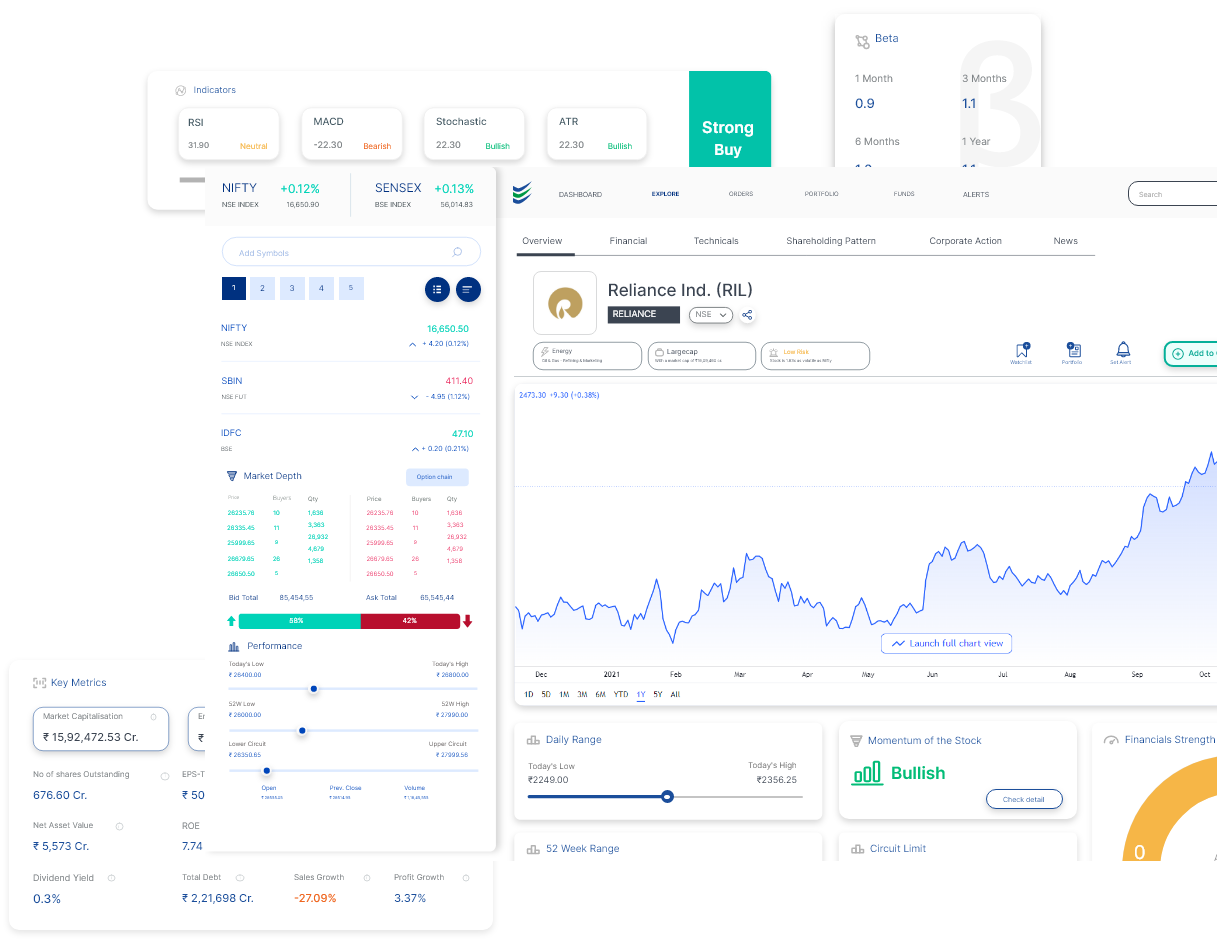
Why ORCA Pro?
 Place Orders after you analyze
After analyzing the stocks, place an order directly from ORCA Pro.
 Bridging Technology & User Experience
Combining cloud storage & the latest technologies to provide a seamless experience for users.
 User-Friendly Platform
The design is kept simple & easy to understand
 Place Orders after you analyze
Daily Live Levels of all Stocks, Technical Analysis (Pivot Levels, Averages, Oscillators etc.) and related Articles.
 Daily Range
Today's Low
₹ 2249.00
Today's Low
₹ 2249.00
52 Week Range
Today's Low
₹ 2249.00
Today's Low
₹ 2249.00
Stock Momentum
To predict the overall market trend (Bullish/Bearish) based on 25+ Variables.
 Momentum of the Stock
 Bullish
Circuit Limit
Upper
₹ 2249.00
Lower
₹ 2249.00
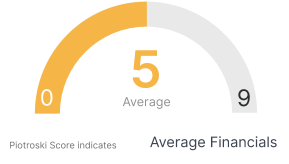
Piotroski score
To identify the strength of the stocks
 Financials Strength Score
Open a Demat Account with Enrich Money in Just a Few Minutes.
Open a Demat Account

FAQs
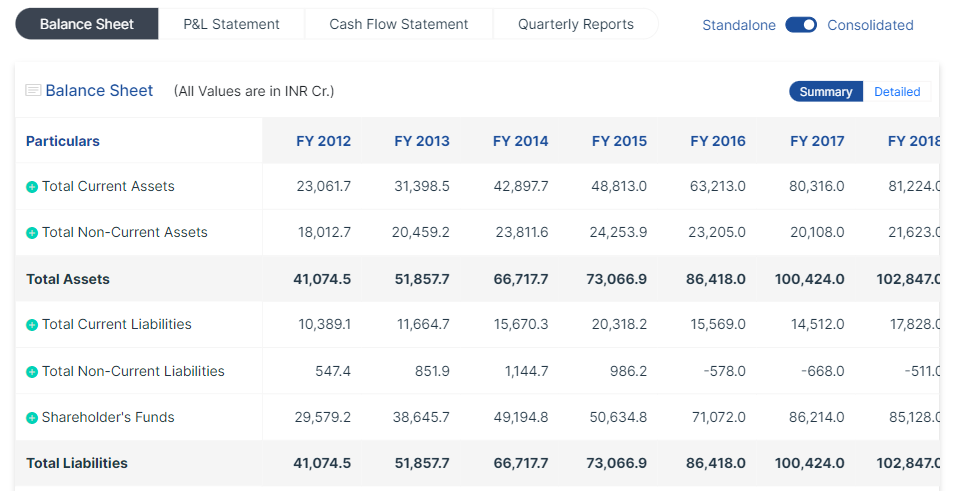
To Analyse a stock fundamentally
- we have to look at the company's financial strength, which is already available for all companies in ORCA pro using the Piotroski Score method.
- Sales Growth
- PAT Growth
- EPS
- PE
- ROCE
And many more financial ratios are also available to clearly understand how the company is doing; hence, if all the indicators consistently give a positive outlook, we can decide to take a position as per the risk appetite.
To analyze a stock price, you have to look at the technical indicators to understand if it is in the overbought zone or otherwise, for which you have to look at
- Stoch RSI
- ROC
- UltimateOscillator
- Williams Indicator
- CCI Indicator
- MACD
- EMA & SMA Levels
- Beta
- RSI
- ATR
We can go for a position if all the above indicators give a positive outlook and a buy signal.
For analysing the MF, we have first to look at the holdings of the scheme and its heavyweights; once we take the heavyweights, we have to start analysing those both fundamentally and technically; doing so, we will able to understand that if MF is risky or not, although every MF has a riskometere to convey the risk. There is another method of analysing the MF, which is with its benchmark, to see if MF is outperforming or underperforming when compared with it.
It is crucial to analyse before investing in market-related products to understand the risk better.
Post-analysis, as per the outcome of the analysis, we can decide to either go ahead with the investment or not.
There are various indicators used to analyse a stock both fundamentally and technically; some of the indicators are:
- Piotroski Score
- Sales Growth
- PAT Growth
- EPS
- PE
- ROCE
- Stoch RSI
- ROC
- UltimateOscillator
- Williams Indicator
- CCI Indicator
- MACD
- EMA & SMA Levels
- Beta
- RSI
- ATR