Nifty Healthcare Stocks: A Side-by-Side Comparison for Investors
Indian Healthcare Industry
The Indian healthcare industry is made up of hospitals, health insurance, medical equipment, clinical and laboratory trials, medical tourism and telemedicine. The Indian healthcare industry is one of the major sectors which provides highest revenue and employment. The healthcare industry has lot of future scope due to increasing lifestyle diseases, demand for healthcare system to every citizen at affordable costs, need for availability of health insurance to all the people living in both rural and urban India, advanced medical technologies and government initiatives like Ayushman Bharat, National Tele Mental Health Programme, universal immunization programmes etc...
Nifty Healthcare Stocks: A Side-by-Side Comparison for Investors
Sun Pharmaceutical Industries Limited
December 2024: Was subject to regulatory scrutiny following an order issued by the Regional Director, North Western Region, Ministry of Corporate Affairs, on alleged non-compliance under Sections 129 and 188 of the Companies Act, 2013.
February 2025: Share prices declined following a weakening in investor sentiment following U.S. President Trump's threat of tariffs on pharmaceutical imports.
March 2025: Expanded oncology portfolio through acquisition of Checkpoint Therapeutics in a $355 million transaction.
Dr. Reddy's Laboratories Limited
March 2025: Announced plans to launch generic semaglutide in India, leveraging patent expiry and growing demand for obesity treatment options.
Cipla Limited
December 2024: Promoters sold a 1.72% stake through block deals, raising ?2,000 crore. The funds were to be directed towards philanthropic activities, after a 15% net profit rise in Q2 FY24.
February 2025: Poised to gain from higher U.S. revenue thanks to supply shortage, according to India Ratings and Research's projection.
March 2025: Developing a generic version of Novo Nordisk's Wegovy, in order to make a foray into India's growing weight-loss medication market.
Indian Healthcare Industry Outlook
-
By FY2025, the Indian Medical Technology industry would generate a revenue of USD 50 billion.
-
In FY2021, the hospital industry generated a revenue of Rs. 7940.87 billion and is expected to generate a revenue of Rs. 18348.78 billion in FY2027 with a CAGR % of 18.24%.
-
By FY2025, the telemedicine industry is expected to generate a revenue of USD 5.4 billion with a CAGR % of 31%
-
By 2030, the National Digital Health Blueprint can generate a revenue of USD 200 billion.
-
GOIs ' Ayushman Bharat - National Health Protection Mission has achieved to be the largest government funded healthcare programmer globally by operating around 156000 centres throughout India.
-
Since FY2014, India has invested around Rs.17691.08 crores for upbringing of 157 institutions in medical education .
-
India is always the preferred destination , where patients around the world come for medical treatment .
Nifty Healthcare Stocks
The Healthcare industry in India is one of the crucial and major revenue generating sectors in the country. The Nifty Healthcare index represents the market performance of the healthcare companies. It comprises 20 stocks that are listed and traded in stock exchanges with a base value of 1000. The Nifty healthcare index serves as a benchmark for fund portfolios, index funds , ETDs and various structured products.
The Nifty Healthcare index was started on 1st April, 2005. This index is rebalanced semi-annually.
|
Company Name |
Weightage |
|
Sun Pharmaceutical Industries Ltd. |
21.94% |
|
Dr. Reddy's Laboratories Ltd. |
10.22% |
|
Cipla Ltd. |
9.94% |
|
Max Healthcare Institute Ltd. |
8.40% |
|
Apollo Hospitals Enterprise Ltd. |
8.10% |
|
Divi's Laboratories Ltd. |
6.90% |
|
Lupin Ltd. |
5.38% |
|
Aurobindo Pharma Ltd. |
4.39% |
|
Alkem Laboratories Ltd. |
3.28% |
|
Torrent Pharmaceuticals Ltd. |
3.27% |
|
Zydus Lifesciences Ltd. |
3.26% |
|
Ipca Laboratories Ltd. |
2.44% |
|
Laurus Labs Ltd. |
2.39% |
|
Glenmark Pharmaceuticals Ltd. |
2.14% |
|
Abbott India Ltd. |
1.90% |
|
Biocon Ltd. |
1.79% |
|
Syngene International Ltd. |
1.69% |
|
Dr. Lal Path Labs Ltd. |
1.18% |
|
Granules India Ltd. |
0.78% |
|
Metropolis Healthcare Ltd. |
0.63% |
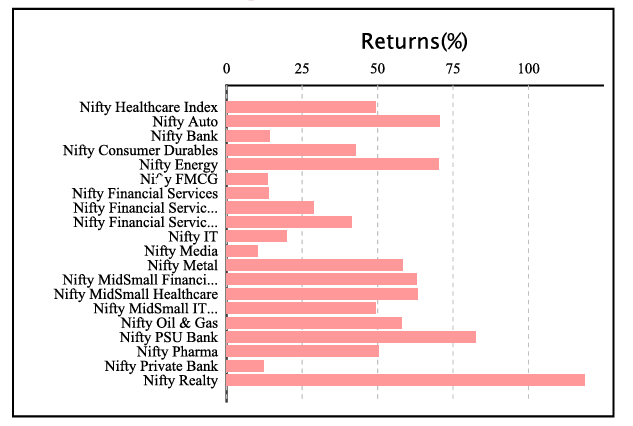
Performance Comparison of all Sector Indices for a period of 1 year in NSE
Nifty healthcare stocks have delivered a total return of 50.46% for a period of 1 year. The price return for a period of 1 year is 49.43%. The total price return on quarter to date was – 0.70% and year to date was 12.79%
Historical Price Analysis of Nifty healthcare for a period of 1 year
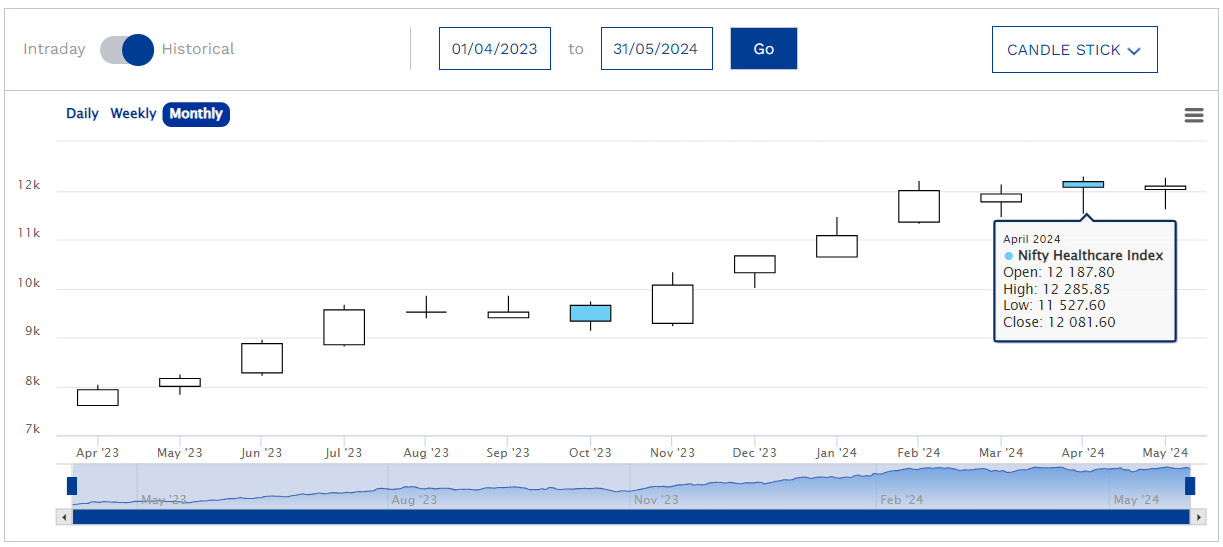
The price to equity ratio is 41.28 and price to book ratio is 5.71. The Nifty healthcare index has delivered a dividend yield of 0.58%.
Eligibility Criteria for Nifty Healthcare Constituent Stock
-
The stock considered for Nifty Healthcare constituents should be part of Nifty 500 .
-
The stock companies should belong to the Macroeconomic healthcare sector.
-
Final selection of 20 companies will be based on the free-float market capitalization method.
-
Weightage of each stock in Nifty Healthcare index is calculated such that no single stock should be more than 33% and weightage of top 3 stocks cumulatively should not be more than 62% at the time of rebalancing.
Nifty Healthcare Stock Comparison
To analyze the Nifty Healthcare stocks, let’s consider three of the Nifty Healthcare Stocks for comparative analysis.
Welcome to the digital world of investing with Enrich Money. Avail free demat trading account from Enrich Money, a wealth tech management company.
Let’s consider the below stocks for comparative analysis.
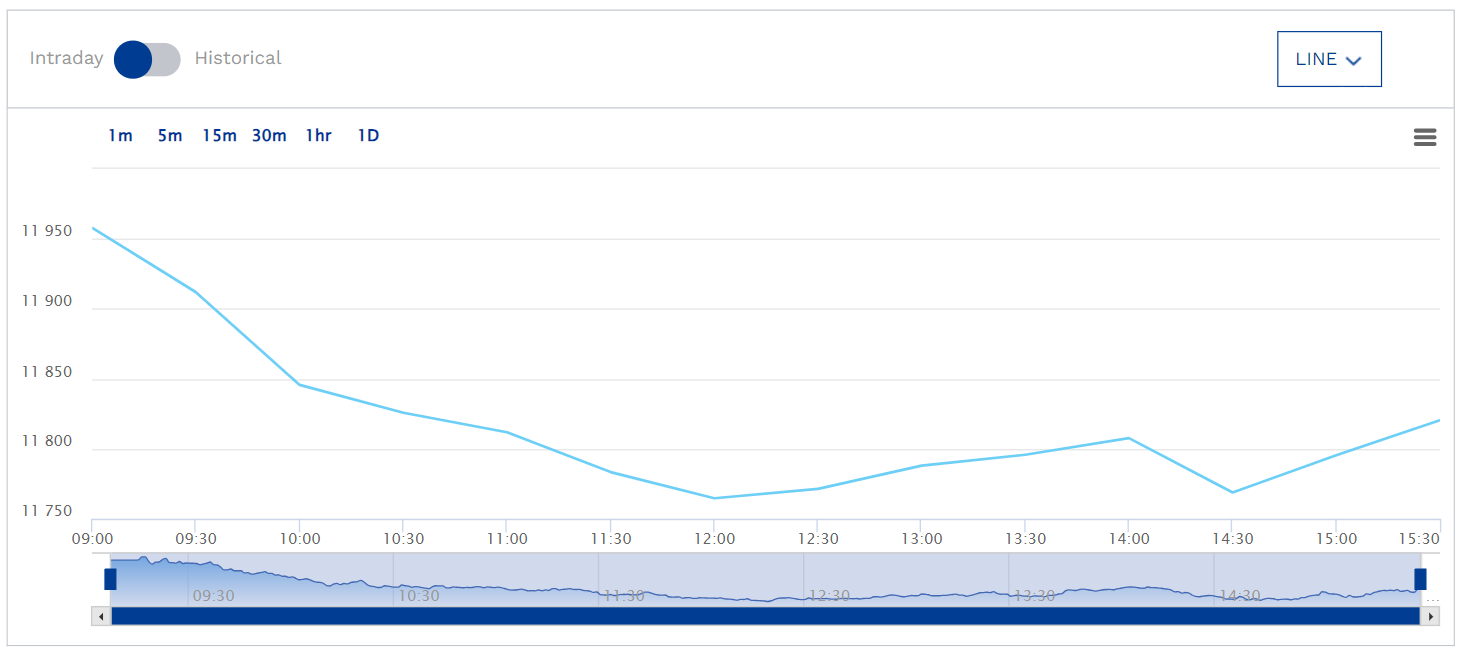
Intraday Price Comparative Analysis
|
Stock Name (as of 31st May, 2024) |
Sun Pharmaceutical Industries Ltd. |
Dr. Reddy's Laboratories Ltd. |
Cipla Ltd. |
|
Open (INR) |
Rs.1465 |
Rs.5899.95 |
Rs.1466.95 |
|
High (INR) |
Rs.1479.40 |
Rs.5904.65 |
Rs.1472.70 |
|
Low (INR) |
Rs.1440 |
Rs.5752.85 |
Rs.1440 |
|
Last Traded Price (INR) |
Rs.1459.80 |
Rs.5791.85 |
Rs.1447.20 |
|
Price Change (INR) |
Rs.39.40 |
Rs.151.8 |
Rs.32.7 |
|
Price Change (%) |
-1.32% |
-1.91% |
-1.73% |
|
Volume |
5503924 |
1029318 |
3270743 |
|
Previous Close (INR) |
Rs.1459.10 |
Rs.5873.75 |
Rs.1466.60 |
Based on the intraday price analysis, the share price of the healthcare stocks is in negative price change.
Monthly Price Comparative Analysis
|
Stock Name |
Sun Pharmaceutical Industries Ltd. |
Dr. Reddy's Laboratories Ltd. |
Cipla Ltd. |
|
Date |
Closing Price in INR |
||
|
May 31, 2024 |
1,459.80 |
5,791.85 |
1,447.20 |
|
May 1, 2024 |
1,459.10 |
5,873.75 |
1,493.55 |
|
Apr 1, 2024 |
1,502.10 |
6,204.30 |
1,400.00 |
|
Mar 1, 2024 |
1,620.55 |
6,157.90 |
1,496.95 |
|
Feb 1, 2024 |
1,577.95 |
6,424.25 |
1,480.35 |
|
Jan 1, 2024 |
1,418.45 |
6,121.15 |
1,351.00 |
|
Dec 1, 2023 |
1,259.45 |
5,797.90 |
1,246.30 |
|
Nov 1, 2023 |
1,225.85 |
5,788.15 |
1,212.30 |
|
Oct 1, 2023 |
1,088.60 |
5,367.55 |
1,200.00 |
|
Sep 1, 2023 |
1,158.65 |
5,587.00 |
1,186.15 |
|
Aug 1, 2023 |
1,111.60 |
5,607.85 |
1,257.60 |
|
Jul 1, 2023 |
1,143.40 |
5,640.45 |
1,175.00 |
|
Jun 1, 2023 |
1,051.60 |
5,159.60 |
1,014.95 |
While observing the monthly stock price data, the stock price of all the three healthcare stocks is in uptrend.
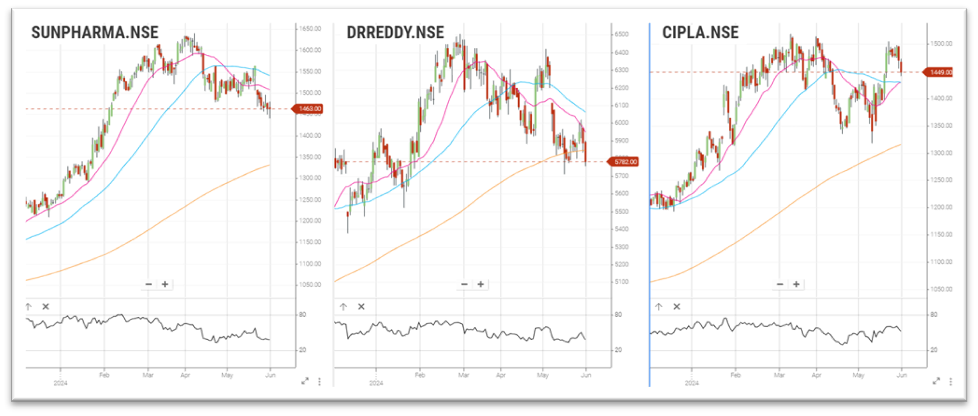
Chart Analysis
Sun Pharmaceutical Industries Ltd.
Sun Pharma, is a multinational company, operating in the business of pharmaceutical manufacturing. Sun Pharma , headquartered in Mumbai, India. Sun Pharma manufactures pharmaceutical formulations and APIs
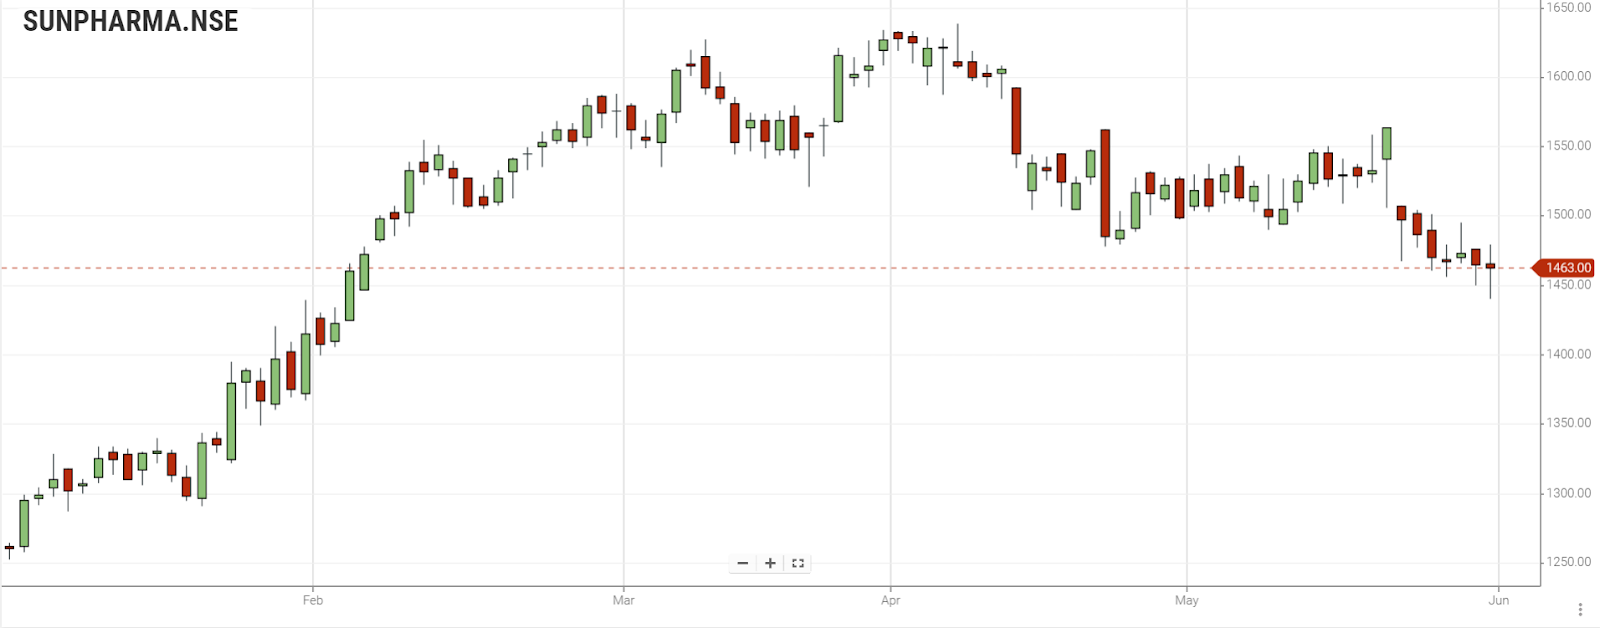
The Bearish Initiation Heikin Ashi pattern is formed on weekly charts. Bearish Heikin Ashi pattern with high volume is observed on monthly price data.
Dr. Reddy's Laboratories Ltd.
Reddy’s Lab , an Indian MNC, operates in the business of pharmaceuticals. Reddy’s lab is headquartered in Hyderabad. The company manufactures pharma products like generic medication, APIs , Biosimilars and OTC drugs.
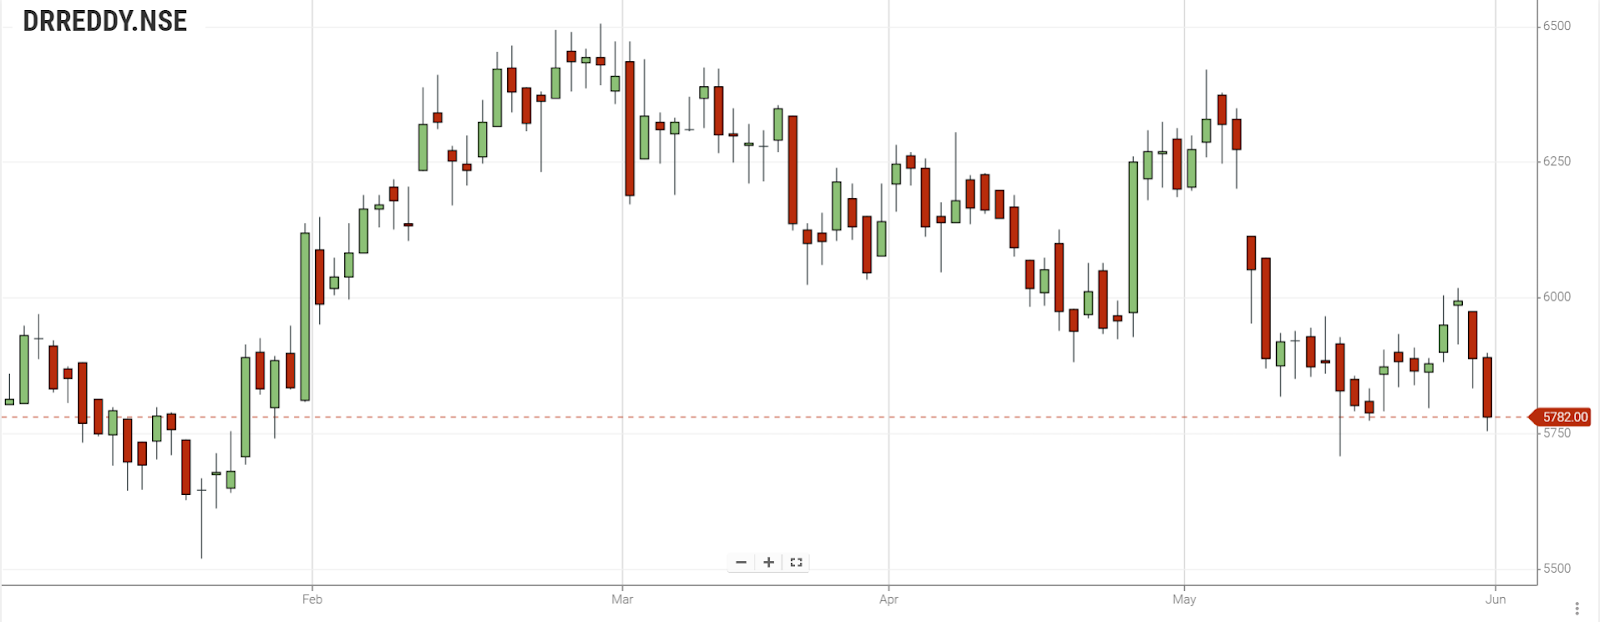
Bearish Initiation Heikin Ashi pattern is formed on daily charts. Bearish Heikin Ashi pattern with high volume is observed on monthly price data.
Cipla Ltd.
Cipla , a MNC company with a rich legacy , operates in the business of manufacturing innovative pharma products. Cipla is headquartered in Mumbai. Company manufactures pharma products like APIs, OTC drugs, generic medication at affordable cost.
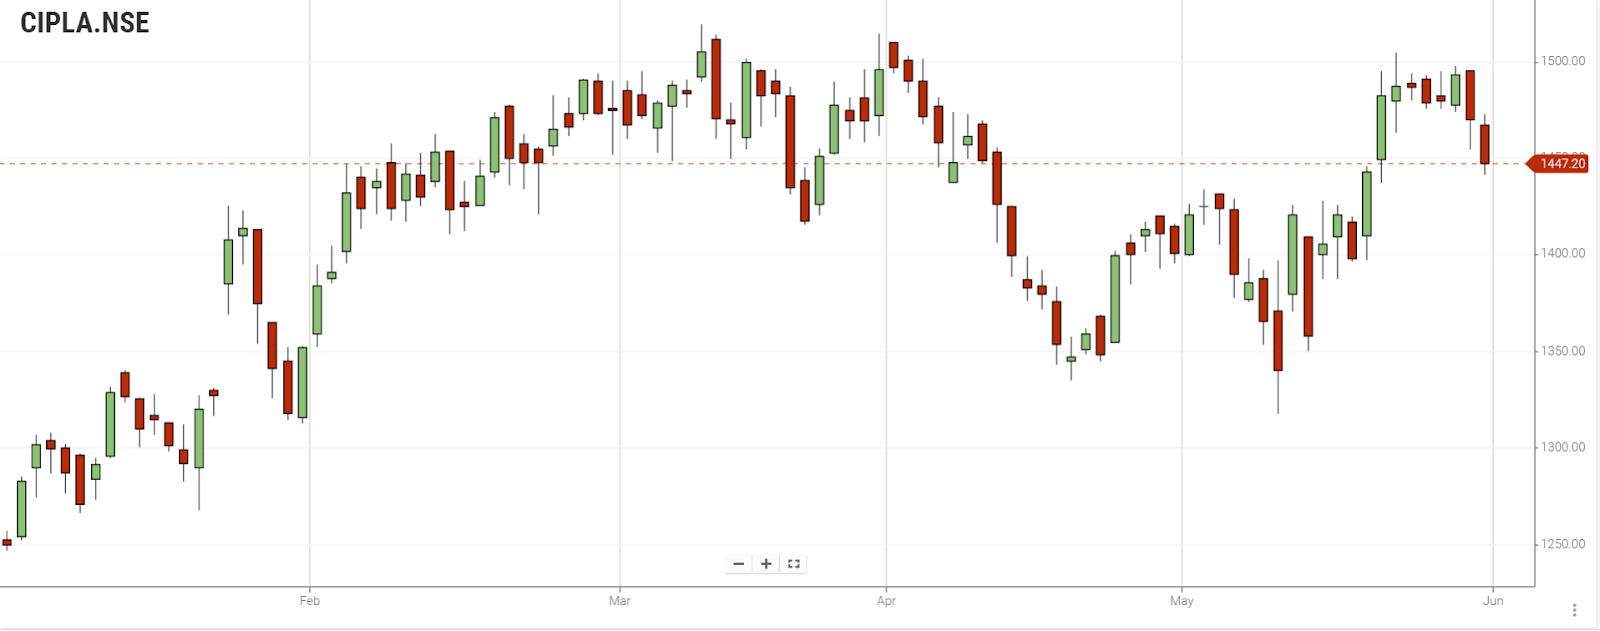
Bullish Initiation Heikin Ashi pattern is formed on daily charts. On monthly price data charts, Candlestick pattern bullish harami formed with no supportive volume.
Fundamental Analysis
|
Stock Name |
Sun Pharmaceutical Industries Ltd. |
Dr. Reddy's Laboratories Ltd. |
Cipla Ltd. |
|||
|
Market Cap (in INR Crores) |
350194.95 |
98034.09 |
118274.65 |
|||
|
Dividend Yield % |
0.92% |
0.68% |
0.89% |
|||
|
TTM EPS (in INR Crores) |
39.91 |
334.37 |
51.04 |
|||
|
TTM PE |
36.57 |
17.58 |
||||
|
P/E |
27.84 |
17.08 |
25.95 |
|||
|
P/B |
4.21 |
3.33 |
3.11 |
|||
|
EPS |
35.32 |
270.55 |
34.71 |
|||
|
ROE |
16.46 |
21.36 |
12.85 |
|||
Sun Pharmaceutical Industries Ltd.
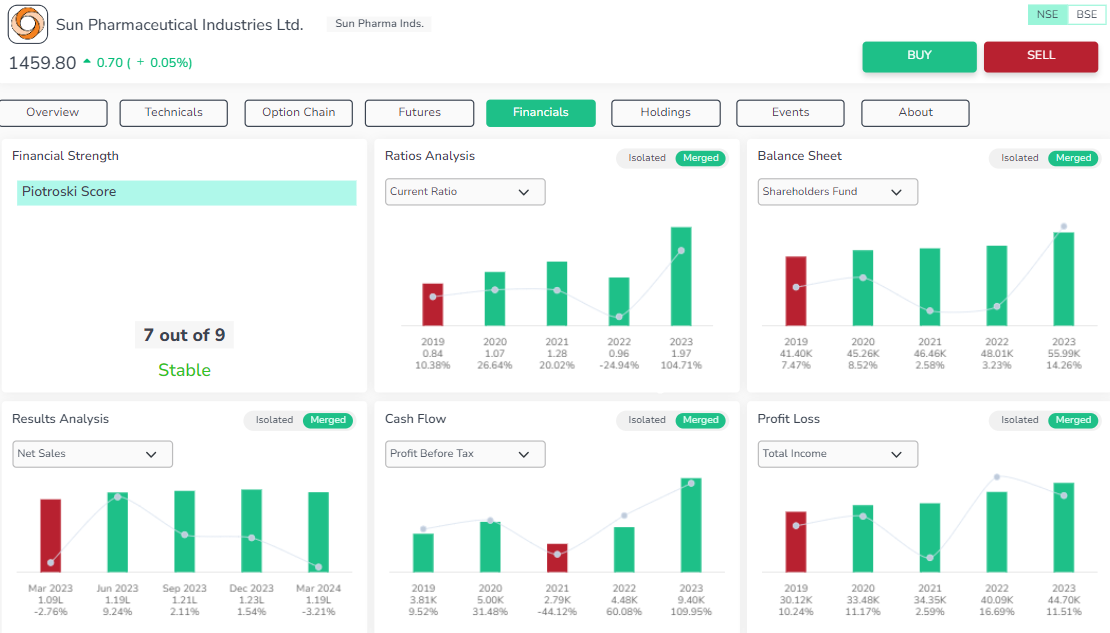
Valuation - The stock is over expensive and the book value of the stock is in uptrend in the last three years.
Profitability -The stock has an excellent piotroski score , with steady EPS growth . The company’s return on profitability is in uptrend. The company’s dividend and earnings yield are very low.
Growth - The company’s growth aspects in last three years has shown tremendous increase
Stability - The stock has excellent stability. Company’s liquidity has also improved.
Dr. Reddy's Laboratories Ltd.
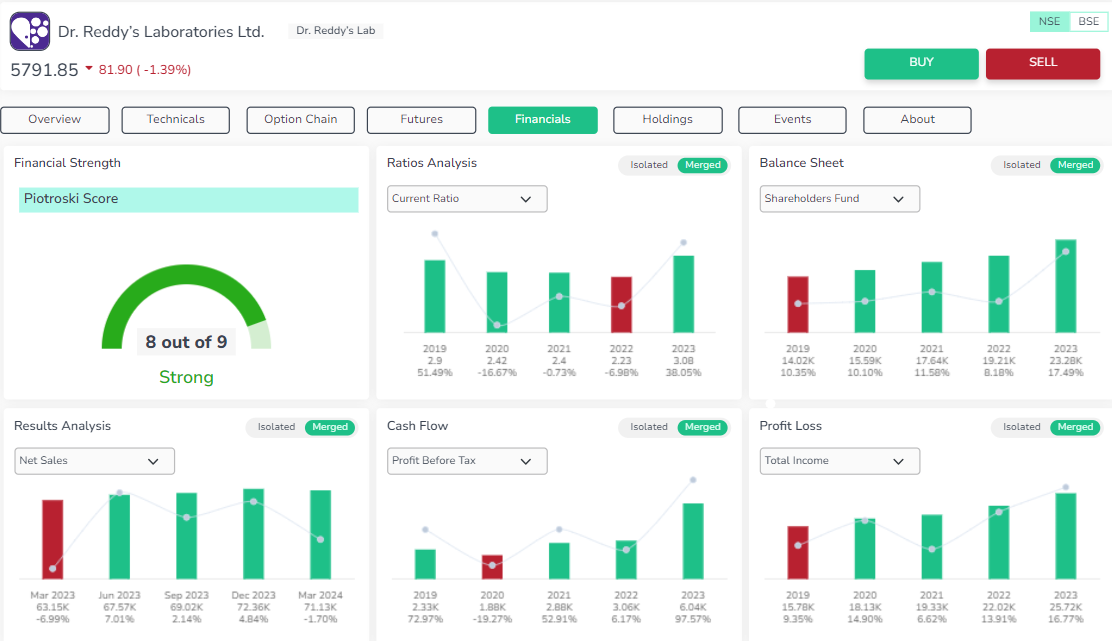
Valuation - The stock is undervalued. And the book value of the stock has been uptrend in the last three years.
Profitability -The stock has an excellent piotroski score. The company’s return on profitability is in uptrend. The company’s dividend , earnings and EPS is very low.
Growth - The company’s growth aspects in the last three years is in uptrend.
Stability -The stock has excellent stability . There is improvement in the company's financial liquidity.
Cipla Ltd.
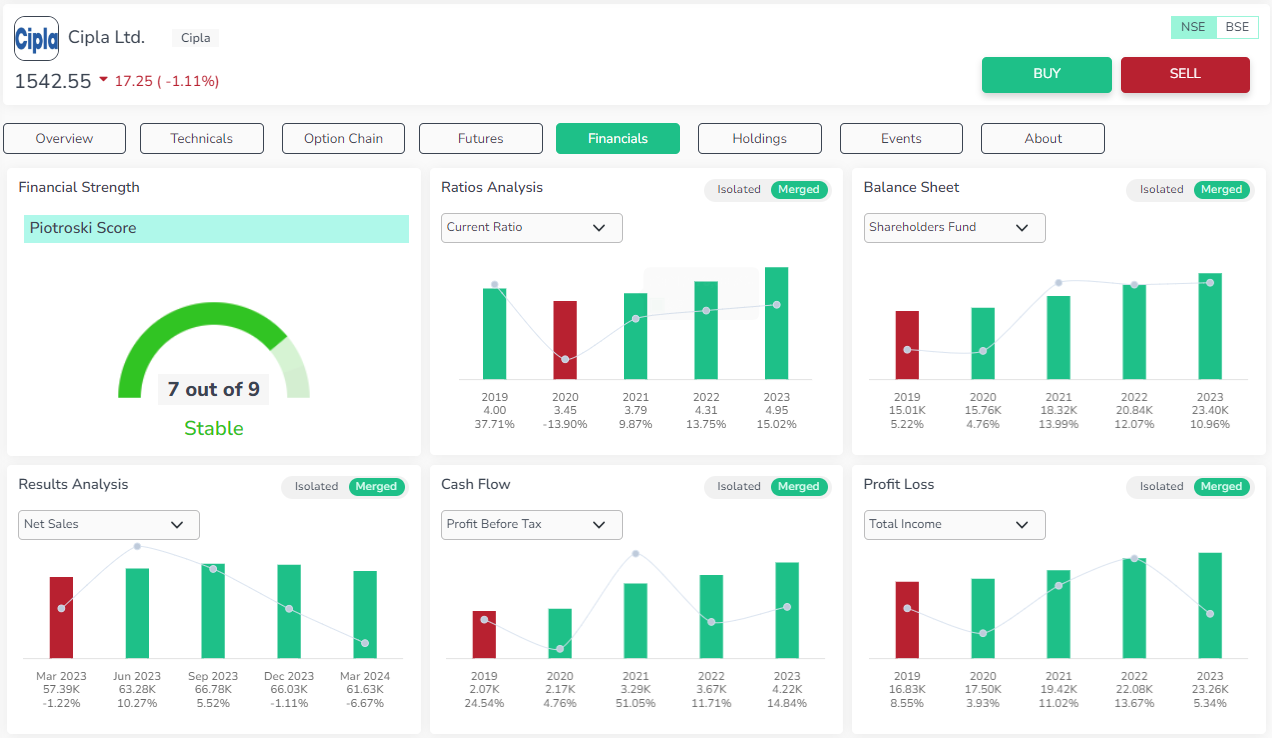
Valuation - The stock is overpriced. The book value of the stock has been uptrend in the last three years.
Profitability - The stock has an excellent piotroski score. The company’s return on profitability is in uptrend. The company’s dividend , earnings and EPS is very low.
Growth – In the last three years, the total assets has increased steadily.
Stability - The stock has excellent stability. Financial liquidity has improved with the debt decreasing and revenue increasing.
Technical Analysis
For comprehensive insights into the technical and fundamental aspects of stocks, log in to the Orca app
|
Technical Analysis @ 31.05.2024 |
|||
|
Stock Name |
Sun Pharmaceutical Industries Ltd. |
Dr. Reddy's Laboratories Ltd. |
Cipla Ltd. |
|
Moving Averages |
|||
|
SMA 20 Days |
1517.68 |
6116.48 |
1438.95 |
|
EMA 20 Days |
1526.6 |
6112.92 |
1425.45 |
|
SMA 200 Days |
1315.99 |
5754.69 |
1266.67 |
|
EMA 200 Days |
1345.84 |
5686.54 |
1263.85 |
|
Indicators |
|||
|
RSI |
49.14 |
35.21 |
28.99 |
|
CCI |
71.21 |
-205.35 |
-176.4 |
|
WILLIAMS_R |
-38.46 |
-86.05 |
-93.3 |
|
UO |
45.4 |
35.97 |
35.17 |
|
Rate of Change |
0.56 |
-3.87 |
-7.62 |
|
MACD |
-7.67 |
-57.69 |
-23.43 |
|
ADX |
0 |
0 |
0 |
|
Standard Pivot Levels |
|||
|
R4 |
1535.7 |
6015.9 |
1359.8 |
|
R3 |
1533.95 |
5996.58 |
1356 |
|
R2 |
1532.2 |
5977.27 |
1352.2 |
|
R1 |
1529.6 |
5958.63 |
1349.6 |
|
Pivot |
1527.85 |
5939.32 |
1345.8 |
|
S1 |
1525.25 |
5920.68 |
1343.2 |
|
S2 |
-1528.7 |
-5938.63 |
-1344.6 |
|
S3 |
1520.9 |
5882.73 |
1336.8 |
|
S4 |
1518.3 |
5864.1 |
1334.2 |
Sun Pharmaceutical Industries Ltd.
SMA and EMA levels indicate that stock exhibits strong bearish signals. The technical indicators imply that the stocks would be neutral to bullish
Dr. Reddy's Laboratories Ltd.
SMA and EMA levels indicate that stock exhibits strong bullish signals. The technical indicators imply that the stocks would be neutral.
Cipla Ltd.
SMA and EMA levels indicate that stock exhibits bullish signals. The technical indicators imply that the stocks would follow either a bullish or bearish pattern.
The below chart exhibits the comparative technical study of three Nifty Healthcare stocks based on Moving average crossover signals and Relative strength index for a period of 6 months.
Conclusion
A thorough comparison of Nifty healthcare stocks using charts, price data, technical indicators, and fundamental analysis offers valuable insights into market performance. This comprehensive analysis aids investors in making informed decisions, managing risks effectively, and optimizing returns in the dynamic healthcare sector.
Enrich Money’s Orca app equips investors with in-depth analysis of stock momentum. It is recommended that investors conduct a detailed analysis using both technical and fundamental tools before making any investment decisions.
Frequently Asked Questions
What are Nifty Healthcare stocks?
Nifty Healthcare stocks refer to the companies listed in the Nifty Healthcare Index, which tracks the performance of the healthcare sector within the National Stock Exchange (NSE) of India. This includes companies involved in pharmaceuticals, hospitals, medical devices, diagnostics, and other healthcare services.
Why should I invest in Nifty Healthcare stocks?
Investing in Nifty Healthcare stocks can provide exposure to a sector that is essential and continuously growing due to increasing healthcare needs, technological advancements, and rising health awareness. The sector also offers diversification benefits and the potential for long-term growth.
What should I evaluate before investing in healthcare stocks?
Key factors to consider include the company’s financial health, growth potential, product pipeline, regulatory environment, market position, and competitive landscape. Additionally, investors should analyze macroeconomic factors such as healthcare policies, demographic trends, and global health issues.
How can I analyze Nifty Healthcare stocks?
Investors can analyze Nifty Healthcare stocks using a combination of technical and fundamental analysis. Technical analysis involves examining stock price charts, volume, and various indicators to identify trends and entry/exit points. Fundamental analysis involves assessing financial statements, earnings growth, valuation ratios, and industry outlook to determine the intrinsic value of the stocks.
What are the risks associated with investing in Nifty Healthcare stocks?
Risks include regulatory changes, patent expirations, clinical trial failures, competitive pressures, and market volatility. Additionally, the healthcare sector can be impacted by global health crises, changes in government policies, and fluctuations in foreign exchange rates.
Disclaimer: This blog is dedicated exclusively for educational purposes. Please note that the securities and investments mentioned here are provided for informative purposes only and should not be construed as recommendations. Kindly ensure thorough research prior to making any investment decisions. Participation in the securities market carries inherent risks, and it's important to carefully review all associated documents before committing to investments. Please be aware that the attainment of investment objectives is not guaranteed. It's important to note that the past performance of securities and instruments does not reliably predict future performance.