Knowledge Center Technical Analysis
Extraordinary Technical Pattern
Diamond Chart Pattern
Introduction
The Diamond Chart Pattern is a technical analysis pattern that forms on price charts, resembling a diamond shape.
It is a stock market chart pattern signalling potential trend reversal points in the market, with a Diamond Top indicating a potential shift from an uptrend to a downtrend and a Diamond Bottom suggesting a possible reversal from a downtrend to an uptrend.
The pattern typically exhibits decreasing volume during its formation and often leads to a breakout, which can provide a signal for a new trend
How does a Diamond Chart pattern look like?

A Diamond Chart Pattern has a distinct visual appearance, resembling a diamond shape on a price chart. It is formed by the intersection of two trendlines, an uptrend line (rising lows) and a downtrend line (falling highs). Here's how a Diamond Chart Pattern looks:
Diamond Top (Bearish):
In a Diamond Top, an uptrend is in place before the pattern forms.
The price begins to swing between higher highs and lower lows, creating a narrowing range.
It results in the formation of a diamond shape on the chart, with the upper and lower trendlines converging.
This pattern often signals a potential reversal from an uptrend to a downtrend when there is a downward breakout from the pattern.
It results in the formation of a diamond shape on the chart with the upper and lower trendlines converging.
This pattern often signals a potential reversal from an uptrend to a downtrend when there is a downward breakout from the pattern.
Diamond Bottom (Bullish):
In a Diamond Bottom, a downtrend exists prior to the pattern formation.
The price starts oscillating between lower highs and higher lows, leading to a narrowing range that forms a diamond shape.
This pattern typically suggests a potential reversal from a downtrend to an uptrend when there is an upward breakout from the pattern.
The Diamond Chart Pattern is characterized by its distinct shape, with the converging trendlines creating a visual representation of a diamond. It is essential for traders and analysts to closely monitor the breakout direction from this pattern, as it provides a signal for potential trend reversals and can guide trading decisions.
When does a Diamond Top Chart pattern is formed?
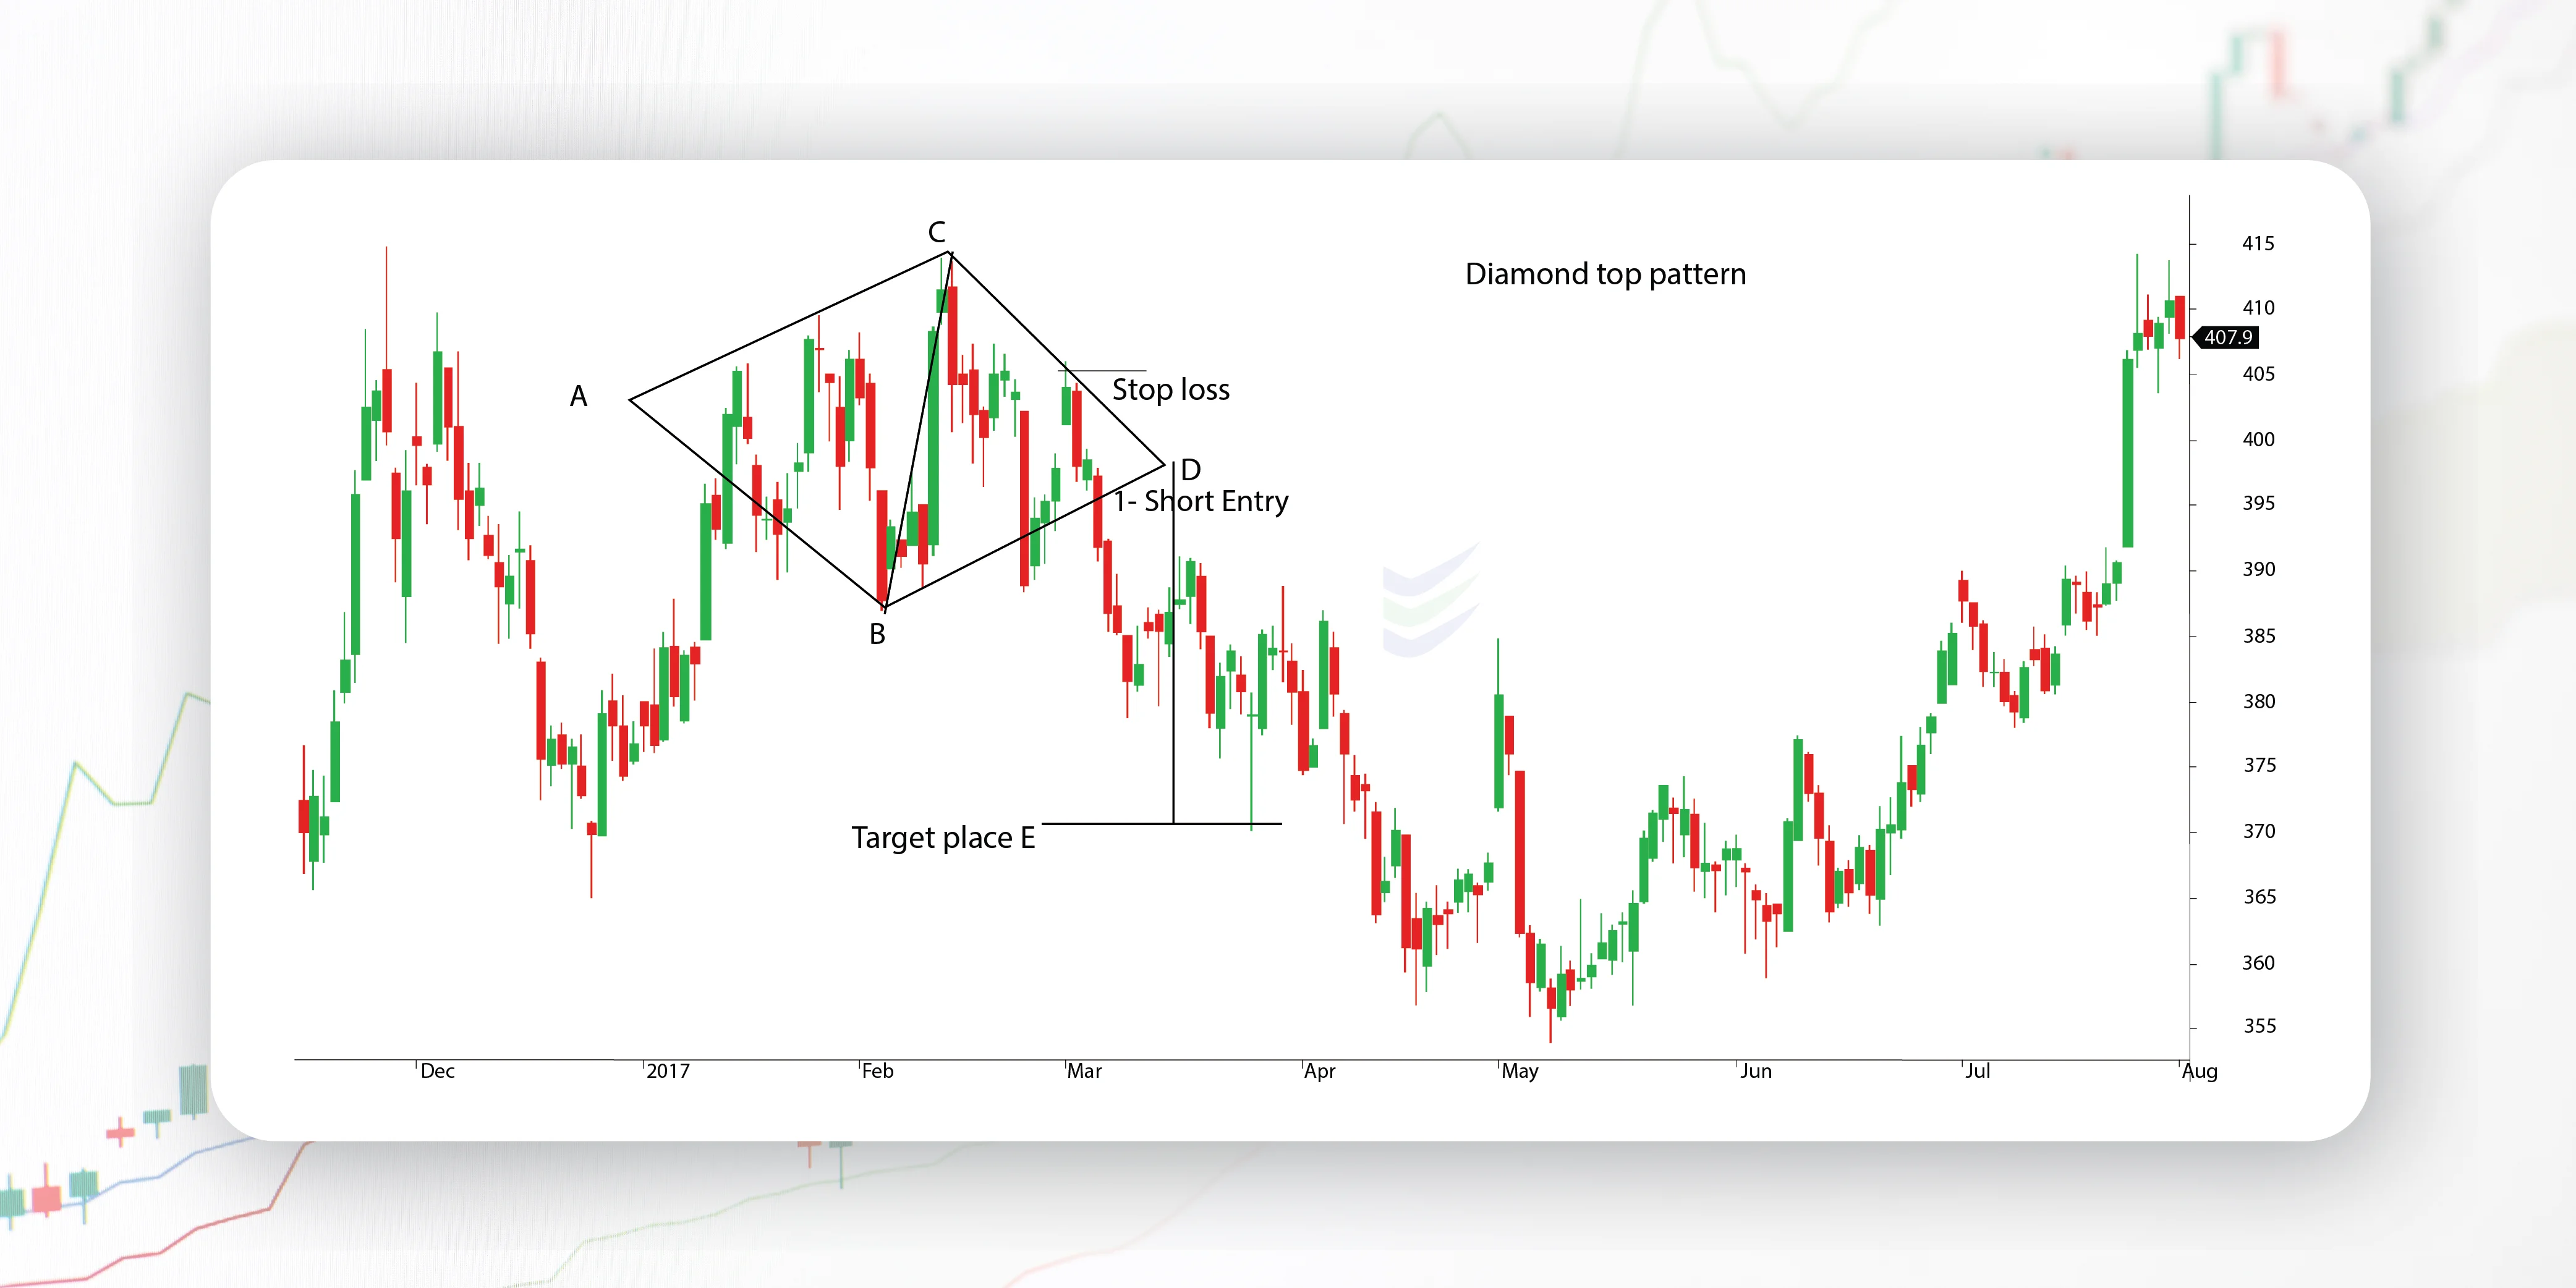
A Diamond Top Chart Pattern is a specific technical chart pattern that typically forms after a prolonged uptrend in a financial market. It signals a potential trend reversal from bullish (upward) to bearish (downward). Let's delve into the details of when and how a Diamond Top Chart Pattern is formed:

The minimum price target is the distance calculated between the points B and C, projected from the break out of D.
Prior Uptrend:
The formation of a Diamond Top begins with a well-established uptrend in the market. This uptrend can extend over a significant period, characterized by higher highs and higher lows.
Initial High and Low Points:
During the uptrend, the price reaches a high point and a low point, forming the initial boundaries of the pattern.
The high point is a peak in the price, and the low point is a trough, but both are higher than the previous ones.
Price Consolidation and Pattern Formation:
After the initial high and low points, the price pattern starts to exhibit a series of lower highs and higher lows.
This creates a narrowing range of price movements, with the highs moving lower and the lows moving higher.
The converging trendlines of these lower highs and higher lows result in the formation of a diamond-shaped pattern on the price chart.
Decreasing Volume:
As the Diamond Top pattern develops, trading volume typically decreases. Lower trading volume indicates that market participants are becoming less active and indecisive.
Breakout:
The culmination of the Diamond Top pattern is a breakout. A breakout occurs when the price decisively moves below the lower trendline of the diamond.
The direction of this breakout is crucial:
A downward breakout from a Diamond Top typically signals a bearish reversal, indicating a potential shift from the previous uptrend to a new downtrend.
Confirmation and Target:
Traders often use other technical indicators or patterns to confirm the validity of the breakout.
Additionally, they may estimate a price target by measuring the width of the diamond pattern (the distance between the initial high and low points) and projecting it downward from the breakout point.
Reversal Signal:
A Diamond Top chart pattern in share market serves as a reversal signal, suggesting that the bullish momentum has weakened, and bears might take control of the market.
Traders may use this pattern as a cue to consider short-selling or exiting long positions.
When does a Diamond Bottom Chart pattern is formed?
A Diamond Bottom Chart Pattern is a specific technical chart pattern that typically forms after a prolonged downtrend in a financial market. It signals a potential trend reversal from bearish (downward) to bullish (upward). Let's explore the details of when and how a Diamond Bottom Chart Pattern is formed:

The minimum price target is the distance calculated between the points B and C, projected from the breakout of D.It operates on the same basis as a diamond top pattern in the opposite direction.
Prior Downtrend:
The formation of a Diamond Bottom begins with a well-established downtrend in the market. This downtrend can extend over a significant period, characterized by lower highs and lower lows.
Initial Low and High Points:
During the downtrend, the price reaches a low point (trough) and a high point (peak), forming the initial boundaries of the pattern.
The low point is a trough in the price, and the high point is a peak, but both are lower than the previous ones.
Price Consolidation and Pattern Formation:
After the initial low and high points, the price starts to exhibit a series of lower high higher low pattern.
This creates a narrowing range of price movements, with the lows moving higher and the highs moving lower.
The converging trendlines of these higher lows and lower highs result in the formation of a diamond-shaped pattern on the price chart.
Decreasing Volume:
As the Diamond Bottom pattern develops, trading volume typically decreases. Lower trading volume indicates that market participants are becoming less active and indecisive.
Breakout:
The culmination of the Diamond Bottom pattern is a breakout. A breakout occurs when the price decisively moves above the upper trendline of the diamond.
The direction of this breakout is crucial:
An upward breakout from a Diamond Bottom typically signals a bullish reversal, indicating a potential shift from the previous downtrend to a new uptrend.
Confirmation and Target:
Traders often use other technical indicators or patterns to confirm the validity of the breakout.
Additionally, they may estimate a price target by measuring the width of the diamond pattern (the distance between the initial low and high points) and projecting it upward from the breakout point.
Reversal Signal:
A Diamond Bottom pattern serves as a reversal signal, suggesting that the bearish momentum has weakened, and bulls might take control of the market.
Traders may use this pattern as a cue to consider buying or entering long positions.
What does a Diamond Chart pattern indicate?
The Diamond Top and Diamond Bottom chart patterns are both considered reversal patterns in technical analysis. They indicate potential changes in the prevailing market trend, but in opposite directions. Here's what each pattern indicates:
Diamond Top (Bearish Reversal):
A Diamond Top pattern typically forms after a sustained uptrend in the market.
Indication: It suggests that the previous bullish trend may be losing momentum and that a bearish reversal might be on the horizon.
Formation: The pattern consists of a series of lower highs and higher lows, forming a diamond shape on the chart.
Breakout: The bearish signal occurs when the price decisively breaks below the lower trendline of the diamond. This is seen as a confirmation of the reversal.
Implication: Traders may interpret a Diamond Top as a cue to consider short-selling or exiting long positions, as it suggests a potential shift from an uptrend to a downtrend.
Diamond Bottom (Bullish Reversal):
A Diamond Bottom pattern typically forms after a sustained downtrend in the market.

Indication: It suggests that the previous bearish trend may be losing strength, and a bullish reversal could be in the offing.
Formation: The pattern comprises a series of higher lows and lower highs, forming a diamond shape on the chart.
Breakout: The bullish signal occurs when the price decisively breaks above the upper trendline of the diamond. This serves as a confirmation of the reversal.
Implication: Traders may interpret a Diamond Bottom as a cue to consider buying or entering long positions, as it suggests a potential shift from a downtrend to an uptrend.
How to trade when you see a Diamond Chart pattern?
Trading Diamond Top and Diamond Bottom Chart patterns involves using these reversal patterns as signals for potential trend changes. Here are general guidelines for trading pattern chart when you spot these patterns:
Trading a Diamond Top (Bearish Reversal):
Confirmation: Wait for a clear breakout below the lower trendline of the diamond. The breakout should be accompanied by increased trading volume, which can provide added confirmation.
Entry: After the breakout, consider short-selling or exiting existing long positions to capitalize on the expected downtrend.
Stop-Loss: Set a stop-loss order above the recent swing high or the highest point within the diamond pattern. This helps limit potential losses if the market reverses.
Take Profit: Determine a target price based on the width of the diamond pattern. Measure the distance from the highest high to the lowest low within the pattern and project it downward from the breakout point. This can serve as a potential price target.
Risk Management: Always use proper risk management techniques, such as position sizing, to ensure that potential losses are controlled.
Confirmation Indicators: Consider using additional technical indicators like moving averages, relative strength, or oscillators to confirm the bearish sentiment.
Trading a Diamond Bottom (Bullish Reversal):
Confirmation: Wait for a clear breakout above the upper trendline of the diamond pattern. Look for increased trading volume as a sign of confirmation.
Entry: After the breakout, consider buying or entering long positions to take advantage of the expected uptrend.
Stop-Loss: Set a stop-loss order below the recent swing low or the lowest point within the diamond pattern to limit potential losses.
Take Profit: Determine a target price based on the width of the diamond pattern. Measure the distance from the lowest low to the highest high within the pattern and project it upward from the breakout point. This can serve as a potential price target.
Risk Management: Utilize proper risk management techniques, such as position sizing, to manage potential losses.
Confirmation Indicators: Consider using additional technical indicators to confirm the bullish sentiment, such as moving averages, relative strength, or oscillators.
Frequently asked questions
What is w chart pattern?
A technical analysis pattern resembling the letter "W" formed by stock price movements.Indicates a potential reversal in a downtrend, with two low points followed by a higher low, suggesting a shift in market sentiment.Traders often interpret the pattern as a signal to enter long positions, anticipating a bullish reversal in the stock's price.
What is the v shape chart pattern?
A technical analysis pattern characterized by a sharp and rapid reversal in price, forming a pattern that resembles the letter "V." Typically occurs after a significant decline, indicating a swift recovery and a potential bullish trend reversal. Investors may interpret the V-shape pattern as a signal to enter long positions, anticipating a strong bounce back in the asset's value.
How do I set stop-loss and take-profit levels when Diamond pattern trading?
Traders typically set stop-loss orders just beyond the recent swing high or low within the pattern. Take-profit levels can be estimated based on the width of the pattern projected in the direction of the breakout.
Can I use Diamond patterns in combination with other technical analysis tools?
Yes, traders often use Diamond patterns in conjunction with other technical indicators like moving averages, relative strength, or oscillators to confirm signals and enhance their analysis.
What is the recommended approach for trading based on Diamond patterns?
Traders should use Diamond patterns as part of a comprehensive trading strategy, conduct thorough analysis, and exercise discipline in their trading decisions. Risk management is also crucial when trading any pattern.