Knowledge Center Technical Analysis
Extraordinary Technical Pattern
What Is the ABCD Trading Pattern?
The ABCD pattern is a harmonic formation found on trading charts It is an essential tool in technical analysis. It comprises four reversal points, conveniently labeled A, B, C, and D. Visually, it resembles a lightning bolt, making it easy to identify.
The beauty of ABCD patterns lies in their versatility. We can apply them to any chart timeframe and virtually any financial market, including stocks, currencies, commodities, and cryptocurrencies.
These patterns come with specific measurements for each point, making them a favorite among traders. When spotted, they can offer excellent risk-to-reward trading opportunities.

Three Phases of ABCD Pattern
This pattern has three legs, with two of them labeled AB and CD. When you put these legs together, they create a zig-zag shape, which is why it's sometimes called the 'lightning bolt pattern.' You can use it in any financial market and in any time frame.
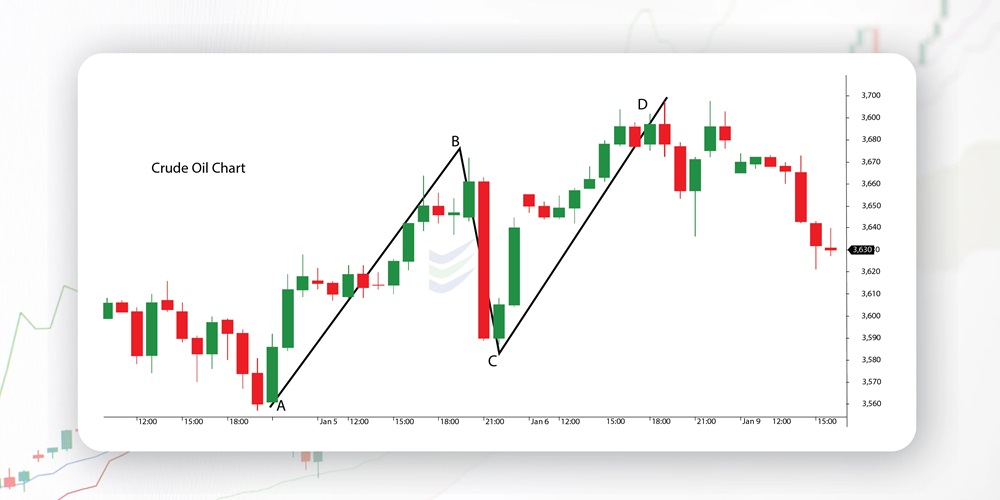
A-B Leg
In the context of the chart pattern, the A-B leg is the initial segment. When the market shows an upward trend, this leg takes shape as the price ascends from point A to point B, as illustrated in the chart above.
B-C Leg
Similarly, at point B, the price undergoes a significant reversal, retracing sharply to create the B-C leg.
During this retracement (from B to C), it typically falls between 38.2% to 78.6% of the A-B leg. However, the most desirable pattern usually features a retracement ranging from 61.8% to 78.6%. The application of Fibonacci analysis becomes crucial at this stage, a technique we will delve into later on.
C-D Leg
In the progression of the pattern, at point C, the price changes direction once more and resumes its initial upward movement. This C-D leg inclines upward, running parallel to the A-B leg. Ideally, it should be of the same length as the A-B leg when it reaches completion.
The perfect AB=CD pattern is characterized by equality in both time and price. Point D, the final point, is typically a Fibonacci extension falling between 127% to 161.8% of the B-C leg.
Point D is the end of the pattern
Referring to the chart above, Point D signifies the conclusion of the pattern. At this juncture, traders have the option to sell (or just prior to D) when the pattern concludes. Alternatively, in a market trending downward, one can consider going long at Point D.
It's important to note that AB=CD patterns, while prevalent, might not always be flawless. The chart above provides a clear illustration of an ideal AB=CD pattern when the Fibonacci tool is utilized. This application showcases both retracements and extensions, offering valuable insights for traders.
How Do We Trade with the AB=CD Pattern?
Examine the AB=CD pattern illustrated in the chart below.
Once you spot the pattern on the chart, focus on trading at Point D.
For instance, if the trend is up, consider a sell trade. If it's down, think of a buy trade. Just flip the pattern and your trading instructions accordingly for a simple approach.
-
Place Your Entry Order:
Start by identifying Point D where the pattern completes, and set your entry order there.
-
Set Your Stop Loss:
Put your stop loss just a few pips above Point D. This guards against an extended C-D leg, which often continues in the same direction.
-
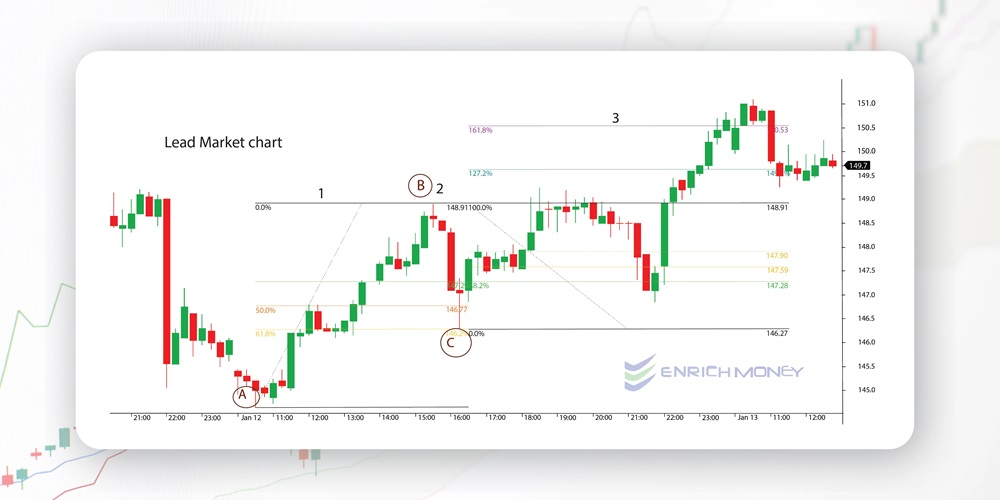
Set your profit target:
Determine your profit target by drawing a new Fibonacci retracement from Point A to D after the original pattern concludes. Once Point D is reached, you can do this. Options include placing your take profit order at 38.2%, 50.0%, and 61.8% levels. If uncertain, choose 61.8%, but monitor price reactions. If it struggles at any level, consider closing the trade and taking profits early.
The chart below displays where the sell order, stop loss, and profit target are placed.
As per the chart,
-
Enter Short Trade:Initiate a short trade at the 1.618% extension point where AB equals CD.
-
Set Stop Loss:Place your stop loss a few pips above the entry point to manage risks.
-
First Profit Target:Consider the 38.2% Fibonacci retracement level as your initial profit-taking option.
-
Second Profit Target:Alternatively, target the 50.0% Fibonacci retracement level for your second profit-taking opportunity.
-
Third Profit Target:For a more ambitious approach, aim for the 61.8% Fibonacci retracement level as your third profit-taking option.
Summary:
-
AB=CD Pattern Basics: AB=CD pattern helps predict price reversals, enabling buying low and selling high.
-
Pattern Structure:Consists of three legs, AB and CD, forming a zig-zag ('lightning bolt') shape. Applicable in any market and timeframe.
-
Pattern Formation:In an uptrend, A-B leg rises; B-C leg retraces (ideally 61.8% or 78.6%); and C-D leg mirrors A-B's length.
-
Trading Approach:Place a sell order at completion point D; set stop loss above D; use Fibonacci retracement for profit target at 61.8% retracement level between A and D.
-
Adaptable to Downtrends:In downtrends, reverse the pattern and trading instructions for a bullish (buy) trade at point D.
Frequently Asked Questions
What is the ABCD Trading Pattern?
The ABCD pattern is a harmonic formation on trading charts with four reversal points (A, B, C, and D) resembling a lightning bolt. It's a versatile tool used in technical analysis.
How does the bullish ABCD pattern work?
The bullish ABCD pattern starts with a significant high (A), followed by a decline to point B. Point C represents a temporary rally retracing 50-78% of AB. Point D, the target, is where traders may consider buying.
What's the bearish ABCD pattern?
The bearish ABCD pattern begins with a significant low (A), followed by a rally to point B. Point C is a higher price than A, retracing 50-78% of AB. Point D, the target, is where traders may consider selling.
How do you identify an ABCD pattern?
Identify it by looking for three consecutive price swings resembling a lightning bolt: AB (a significant trend), BC (a countertrend), and CD (similar to AB in length). Symmetry between AB and CD adds confirmation.
What are the rules for trading with the ABCD pattern?
Follow these rules: Point C remains above (in an uptrend) or below (in a downtrend) point A. BC is the shortest leg. Use Fibonacci retracement for point C. Point D must exceed point B. Calculate point D targets using Fibonacci extensions.