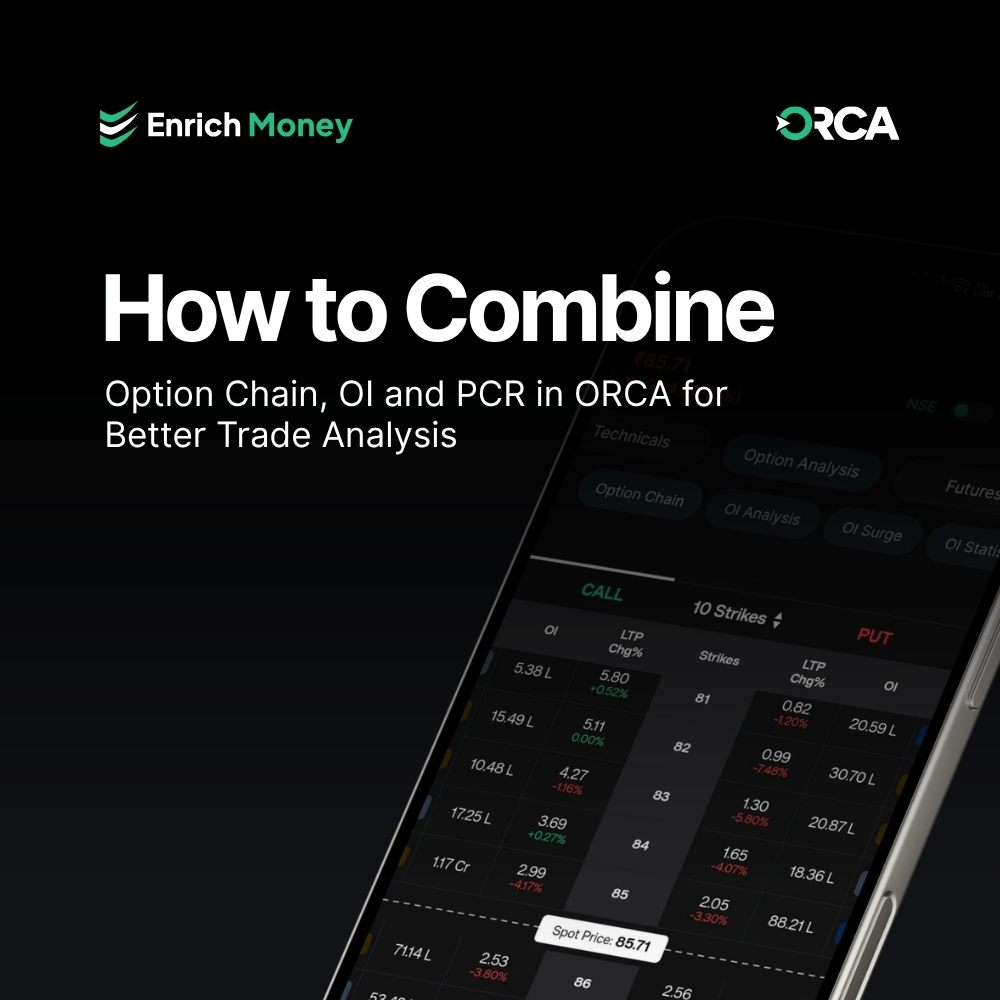
How to Combine Option Chain, OI and PCR in ORCA for Better Trade Analysis
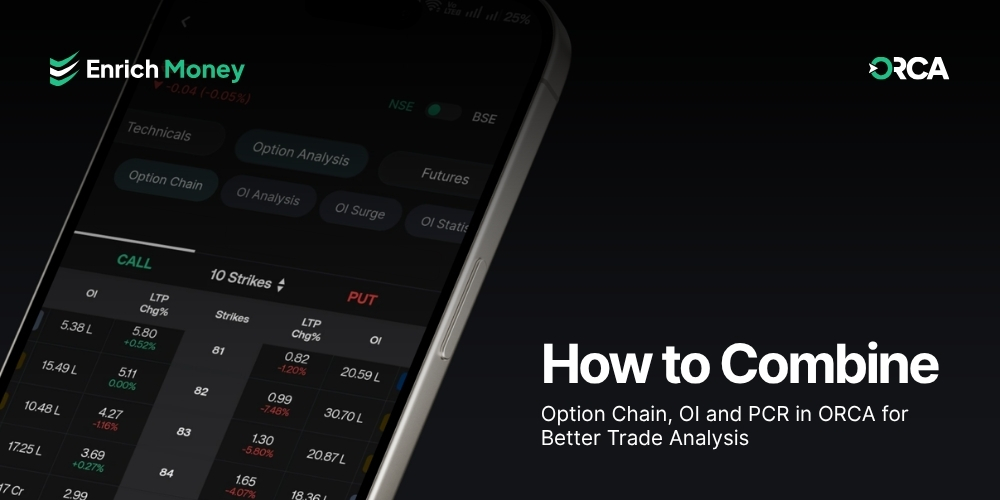
Option trading is much more significant when the traders try to analyse all three elements – Option Chain, Open Interest (OI) and Put-Call Ratio (PCR) rather than rely on any one of these indicators individually. This is because each one of these has their own significance and can be used in combination to make the trading more systematic . ORCA by Enrich Money integrates various options analysis tools in one interface, thus enabling the traders to progress from strike-wise information to OI analysis without having to switch platforms . For traders looking for the best intraday trading app in India, ORCA can simplify this process by bringing key options-analysis features together in a single workflow.
Why Combine Option Chain, OI and PCR?
Each indicator tells a story:
-
Option Chain: Where is the options activity taking place at different strikes?
-
Open Interest: How are positions being established or reduced?
-
PCR: How do the Puts compare against the Calls?
By looking at these indicators individually, we may miss some part of the story. Looking at all these indicators together lets traders know if there is consistency between the price action, OI action and the options sentiments . A large Call OI at certain strike level could mean a resistance level, while a larger Put OI at other strike levels could mean a support level. PCR gives an extra sentiment measure .
ORCA Strategy: Do not base your trade on just one number. Confirm through Option Chain, OI and PCR.
Step 1: Start With the Option Chain in ORCA
It is a sensible place to start one’s study of options, as the Call and Put sides are illustrated at various strike levels . ORCA Option Chain enables traders to choose expiry date and view parameters like OI, LTP, change in LTP, % change in LTP, strike levels and OI interpretations . Below is the option chain of Tata Motors Passenger Vehicles with a spot price of Rs.307.35 and various strike prices in relation to the prevailing market price.

What should traders observe?
OI Calls → Find strikes with high Call position
OI Puts → Find strikes with high Put position
Change in OI → Determine whether positions are building up or unwinding
Strike activity → Find zones where options trading is taking place
Spot Price → Spot price of the underlying compared to option position
Example from the ORCA Option Chain
For the Tata Motors Passenger Vehicles chain shown here, the spot price is Rs. 307.35, and strikes like Rs. 300, Rs. 305, Rs. 310, Rs. 315 and Rs. 320 surround the spot price . On the Calls leg, there are several strikes that exhibit Short Buildup, whereas the Puts show Long Buildup and Short Covering on various strikes . As a trader, you get an instant trigger to proceed with further research rather than relying solely on the movement of the stock price . These terms must be taken as positioning triggers and not necessarily as trade triggers . Trading Tip: Begin with the analysis from the spot price and then move on to strikes that have significant OI and changes.
Step 2: Look Beyond Total OI
Total OI tells us about the total number of open contracts available, but there is still more to learn from Change in OI.
The common understanding is that:
|
Price Action |
OI Change |
Possible Interpretation |
|
Price increases |
OI increases |
Long Buildup |
|
Price decreases |
OI increases |
Short Buildup |
|
Price increases |
OI decreases |
Short Covering |
|
Price decreases |
OI decreases |
Long Unwinding |
However, these combinations must not be seen as a definite trading signal. Before deciding on any action, one should pay attention to price movement, volume, volatility, and market direction.
Example from the ORCA screenshot
Here's an example where the Tata Motors Passenger Vehicles Option Chain highlights how OI by itself might not tell us enough.

In the case of Tata Motors Passenger Vehicles Rs.300 Call, there's a high Call OI coupled with Short Buildup. On the other hand, the Rs.300 Put has substantial OI and Long Buildup . Now we have two distinct data points for the very same strike price of Rs.300 . Instead of immediately deciding the sentiment implied by either of the strikes, a trader could take this into consideration and then analyze further using ORCA's OI Analysis, OI Surge, etc . Pro Tip: Instead of just asking which strike has the most OI, start asking “What is going on with OI and the change in option prices?”
Step 3: Use PCR as a Sentiment Check
PCR brings a new angle for analysis where one considers the behaviour of Puts against Calls.
The Put Call Ratio based on Open Interest can be formulated as follows:
PCR = Total Put OI ÷ Total Call OI
High PCR may suggest that more Puts are being held relative to Calls, while Low PCR may suggest more Calls held than Puts.
But PCR should never be considered in isolation.

High PCR may not necessarily lead to an uptrend in the market, just like how a low PCR will not necessarily lead to a downtrend. Many factors play a role in determining whether to buy or sell . The ORCA PC Ratio section would be useful for traders in analyzing this sentiment indicator along with other options indicators.
Step 4: Consolidate the Indicators
That is where the various analytical capabilities of ORCA could be put to great use.
Example: Possible Bullish Setup
For example, when the underlying is going up with:
-
Rising Put OI in a key support region.
-
Dwindling Call OI at an overhead strike.
-
A positive OI interpretation.
-
A rising PCR.
These could all mean that there is rising bullish sentiment . The trader can then proceed to explore possible bullish strategies.
Key Takeaway
The Option Chain highlights where options positioning lies, OI helps in identifying any shifts in such positioning, and PCR offers a different angle to Put Call sentiment . Nevertheless, no matter what indicators you combine, it will never be possible to predict the future movement of the market with absolute accuracy. Use ORCA together with proper risk management and position sizing . Keep track of market positioning with ORCA’s Option Chain, OI and PCR insights while managing your trades effectively and keeping Demat Charges in mind.
Frequently Asked Questions
Why should traders use Option Chain, OI and PCR together?
They give a more comprehensive analysis of strike-based positions, OI patterns and Put/Call sentiments.
How can Option Chain in ORCA assist options traders?
It shows OI data for Calls and Puts, strike prices, LTP changes and OI analysis at once.
Does high PCR value imply that markets will go up?
Not necessarily. PCR is just an indication of market sentiment and should be evaluated along with other factors such as price, OI, etc.
What does Long Buildup and Short Buildup in ORCA mean?
They represent various combinations of price and OI changes which may be useful in understanding market positioning.
Why should the combination of Option Chain, OI, and PCR be used in ORCA?
Combining these indicators will help traders analyze the positioning at each strike level, along with open interest and the sentiment of puts and calls.
Disclaimer : This blog is dedicated exclusively for educational purposes. Please note that the securities and investments mentioned here are provided for informative purposes only and should not be construed as recommendations. Kindly ensure thorough research prior to making any investment decisions. Participation in the securities market carries inherent risks, and it's important to carefully review all associated documents before committing to investments. Please be aware that the attainment of investment objectives is not guaranteed. It's important to note that the past performance of securities and instruments does not reliably predict future performance.