How to Identify Possible Support and Resistance in Enrich Money’s ORCA App
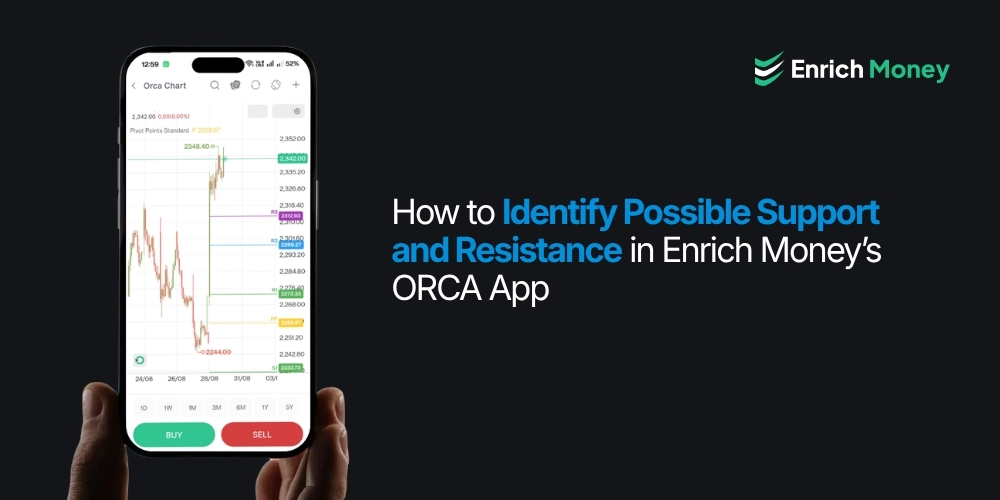
Support and resistance are important price levels that can help traders understand where a stock or index may pause, reverse, or face increased buying and selling pressure. In derivatives trading, Open Interest (OI) data can provide an additional layer of insight into these possible levels . Enrich Money’s ORCA Option Analysis feature brings together Option Chain, OI Analysis, OI Surge and OI Statistics, helping traders study option positioning across strike prices. By combining these tools, traders can identify potential support and resistance zones more effectively . Explore one of the leading stock market apps in India, Enrich Money’s ORCA, to analyse option positioning, OI trends and potential support and resistance zones.
1. Start with the Option Chain
The Option Chain provides a quick view of Call and Put activity across different strike prices.

As shown in the ORCA interface, traders can compare OI, LTP changes and OI interpretation on both sides of the market.
A basic approach is:
-
High Call OI above the current spot price may indicate possible resistance.
-
High Put OI below the current spot price may indicate possible support.
For example, if Maruti Suzuki India Ltd is trading near Rs.13,590, a strike with significant Call writing above the spot price may become a resistance zone. Similarly, strong Put activity at a lower strike can indicate a possible support area . However, traders should avoid relying only on the highest OI number. It is equally important to understand whether positions are being added, closed or reversed.
2. Use OI Analysis to Track Position Changes
The OI Analysis section in ORCA helps traders observe how Open Interest changes over time at a selected strike.

The feature categorises option activity into:
-
Long Buildup
-
Short Buildup
-
Short Covering
-
Long Unwinding
-
Neutral
This classification can provide better context than looking at OI alone.
For instance, increasing Call OI accompanied by falling option prices may indicate fresh Call writing or a Short Buildup. If this occurs near a strike above the current market price, that level may act as a possible resistance . Similarly, increasing Put OI with falling Put premiums can suggest Put writing, which may indicate that traders are defending a lower price zone. This can create a potential support level . The time-based view in ORCA also allows traders to observe whether the positioning is strengthening or weakening during the trading session.
3. Watch OI Surge for Fresh Market Activity
The OI Surge feature is useful for identifying sudden changes in option positioning . Rather than manually scanning every strike, traders can quickly view strikes showing significant activity under categories such as Long Buildup, Short Buildup, Short Covering and Long Unwinding . A sudden surge in Call-side OI at a particular strike can signal increased activity around a possible resistance level. Similarly, a sharp increase in Put-side positioning near a lower strike may highlight a potential support zone.

For example, the ORCA OI Surge screen may show strong fresh Put activity at a strike below the spot price. If the activity continues to build, that strike deserves closer attention as a possible support level.
4. Use OI Statistics for the Bigger Picture
The OI Statistics screen provides a broader strike-wise view of Call and Put Open Interest . The chart makes it easier to identify where large OI concentrations are located. A cluster of high Call OI at one or more higher strikes may indicate a resistance zone, while substantial Put OI at lower strikes may indicate support.

Traders can also compare:
-
Cumulative Call and Put OI
-
Strike-wise OI concentration
-
OI changes
-
Different time intervals
This is particularly useful because support and resistance are often zones rather than exact prices . Explore smarter market insights with an online stock broker that helps you analyse Call and Put OI concentrations to spot potential support and resistance zones.
5. Confirm with Price Action
The most reliable approach is to combine ORCA’s OI data with the actual price movement of the stock or index.
For possible resistance, look for:
-
Heavy Call OI near or above the current price.
-
Fresh Call-side buildup or OI surge.
-
Price struggling to move above that zone.
For possible support, look for:
-
Strong Put OI below the current price.
-
Fresh Put-side buildup.
-
Price repeatedly holding above that area.
Final Thoughts
Enrich Money’s ORCA app can help traders identify possible support and resistance by combining Option Chain data with OI Analysis, OI Surge and OI Statistics. The strongest levels are usually those where high Open Interest is supported by fresh position buildup and confirmed by price behaviour.It is important to remember that OI-based levels are not guaranteed barriers. A sharp price move accompanied by OI unwinding can weaken support or resistance quickly. Therefore, traders should use ORCA’s multiple data views together and confirm their analysis with price action before making a trading decision . Discover how ORCA can support smarter market analysis while exploring is demat account free and the costs involved in opening a demat account.
Frequently Asked Questions
What is support in ORCA?
Support is a price level where the buying interest might show up and stop the stock from going any lower.
What does resistance mean in ORCA?
Resistance is a price level where the selling interest might start showing up and limit the price from going any higher.
How can ORCA help traders find support and resistance?
The charting features of ORCA can help traders analyze price action and find where the price responded to before.
Can the levels of support and resistance change over time?
Yes, they can change with time based on market dynamics.
Should traders base their decisions solely on support and resistance?
No, traders should use them together with other aspects such as volume and price action.
Disclaimer: This blog is dedicated exclusively for educational purposes. Please note that the securities and investments mentioned here are provided for informative purposes only and should not be construed as recommendations. Kindly ensure thorough research prior to making any investment decisions. Participation in the securities market carries inherent risks, and it's important to carefully review all associated documents before committing to investments. Please be aware that the attainment of investment objectives is not guaranteed. It's important to note that the past performance of securities and instruments does not reliably predict future performance.