Knowledge Center Technical Analysis
Superior Analysis
Elliott Wave Theory:
Introduction: What is Elliott Wave Theory?
In the dynamic world of financial markets, where prices are subject to the whims of supply and demand, traders and investors often turn to technical analysis to make sense of market behaviour. One of the most intriguing and widely followed approaches to technical analysis is the Elliott Wave Theory. Developed by Ralph Nelson Elliott in the early 20th century, this theory seeks to decipher market movements by identifying repetitive patterns rooted in human psychology and sentiment.

Concept of Elliott Wave Theory
Elliott Wave Theory is founded on the notion that market prices do not move randomly but instead exhibit discernible patterns that are driven by the collective behaviour of market participants. These patterns manifest as waves, with two main categories: impulsive waves and corrective waves.
Impulsive Waves
Impulsive waves form the core of Elliot Wave Theory and represent the dominant trend direction. They are composed of five smaller waves and provide the foundation for understanding market trends:
Wave 1 (Impulse): Initiates the trend in the dominant direction.
Wave 2 (Correction): Corrects a portion of the gains from Wave
Wave 3 (Strong Impulse): Typically, the most powerful and extended wave.
Wave 4 (Correction): Corrects some of the gains from Wave 3.
Wave 5 (Final Impulse): Marks the last push in the dominant trend.

Most trends unfold in Five waves in the direction of the movement and three waves or combinations of three waves in the direction counter to the primary trend.
Markets usually unfold in threes and fives.
Five wave patterns are impulsive or trend structures.
Three wave patterns are corrective or counter-trend structures.
A five-wave impulse trend and a three-wave or more complex counter-trend have a characteristic structure.
A clear objective of Elliott wave analysis is to perceive in the early stages of the wave structure whether it is more likely to be an impulse or a counter-trend.
Corrective Waves
Following impulsive waves, corrective waves aim to correct the preceding move while maintaining market equilibrium. Corrective waves consist of three waves labelled A, B, and C:
Wave A (Correction): Kicks off the correction phase.
Wave B (Rebound): Represents a rebound or retracement.
Wave C (Final Correction): Often constitutes the most substantial corrective wave.
Elliott wave follows the eight-wave cycle, which together acts as a building block larger pattern.
Elliott Wave Principle
The core principle of Elliott Wave Theory is the repetitive nature of these wave patterns across different Elliott wave timeframe and markets. By identifying and interpreting these patterns, traders and investors can anticipate potential price movements and turning points in the market.
Elliott Wave Degree
In Elliott Wave Theory, the concept of "degree" is a critical aspect used to categorize and describe the significance of waves within the larger Elliott Wave structure. Degrees help analysts and traders understand the relative importance and duration of waves, allowing for a more detailed and nuanced analysis of market price movements.
There are typically nine degrees in Elliott Wave Theory, ranging from the smallest and shortest-term price movements to the largest and longest-term trends. These degrees are labelled with both Roman numerals and numbers, and they are used to describe the hierarchical structure of waves within the theory. Here are the nine degrees, listed from smallest to largest:
Subminuette (i): This is the smallest degree and represents very short-term price fluctuations, often occurring within minutes or hours.
Minuette (ii): Slightly larger than subminuette waves, minuette waves are still relatively short-term and can be observed on intraday charts.
Minute (iii): Minute waves represent intermediate-term price movements, typically observed on hourly or daily charts.
Minor (iv): Minor waves are larger and encompass medium-term price trends. They can be observed on daily and weekly charts.
Intermediate (v): Intermediate waves represent significant price trends that may span several weeks or months and are typically visible on weekly and monthly charts.
Primary (I): Primary waves are large-scale trends that can last for years. They are often visible on monthly and yearly charts.
Cycle (II): Cycle waves represent even larger market trends that span several years or even decades. They are important for long-term investors and macroeconomic analysis.
Supercycle (III): Supercycle waves encompass very long-term trends that can span several decades. These waves are critical for understanding major economic and societal shifts.
Grand Supercycle (IV): The grand supercycle is the largest degree and represents trends that extend over centuries. It's primarily used for historical analysis and understanding very long-term economic and social cycles.
Analysts use degree labels to identify where a particular wave fits within the larger Elliott Wave structure. For example, an analyst might identify a minor degree wave within a primary degree trend. This hierarchical approach allows for a more precise analysis of market behaviour and helps traders and investors make more informed decisions based on their preferred timeframes.
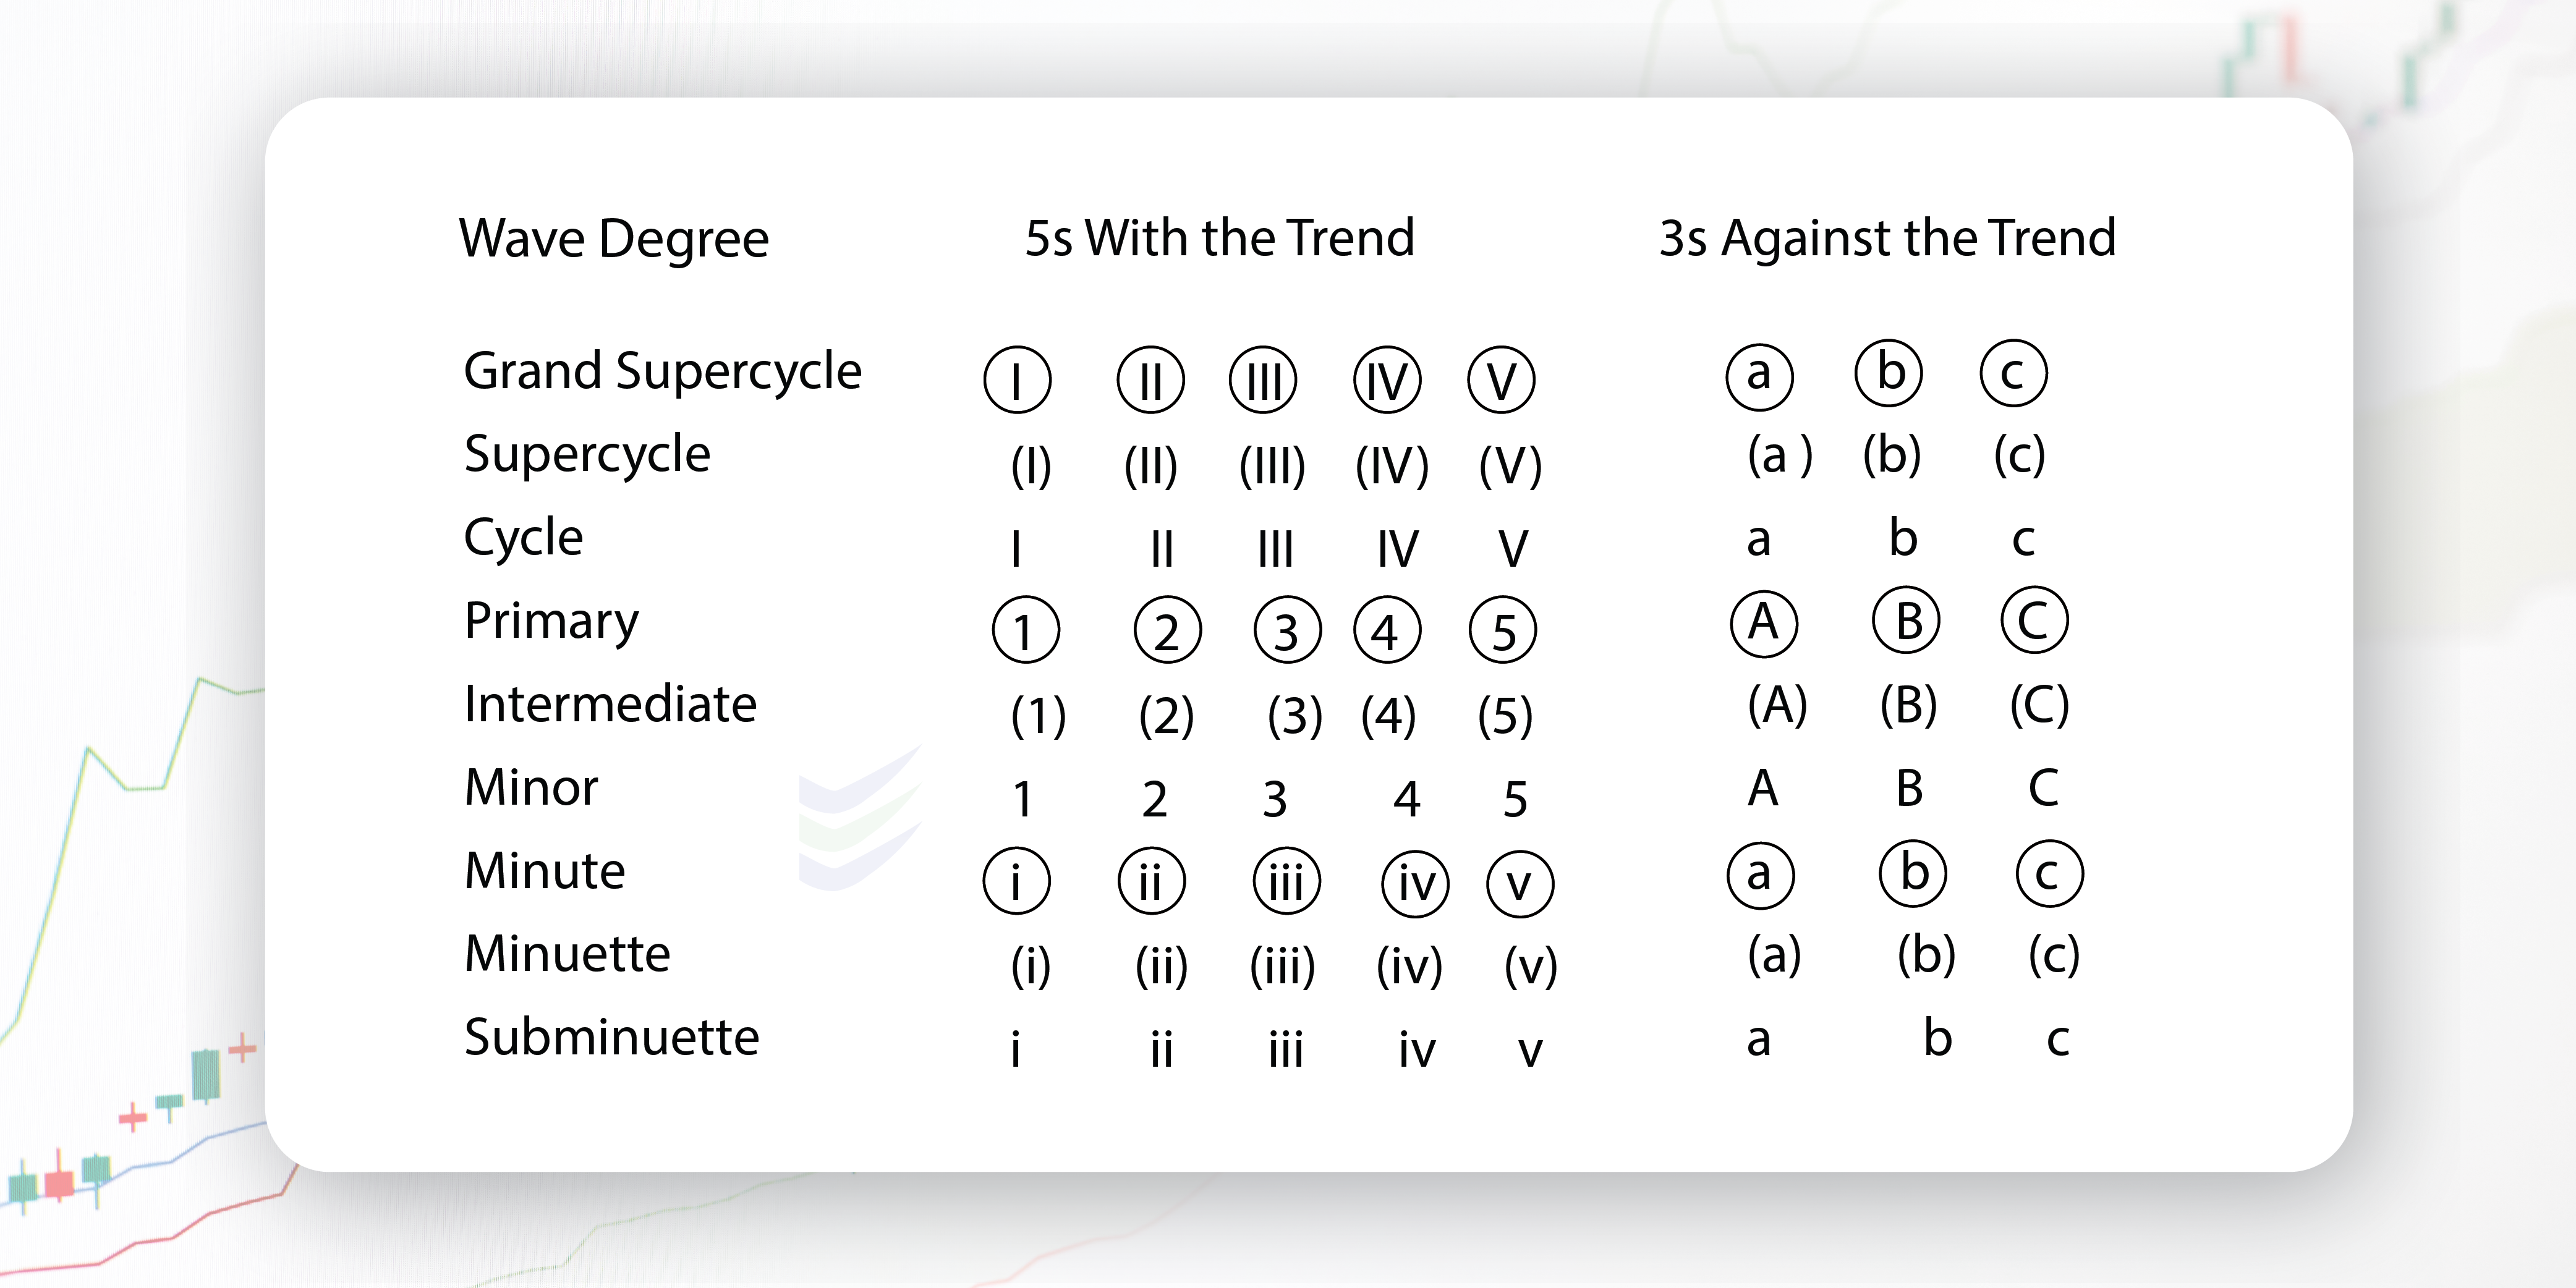
Elliott described nine degrees of waves, from the smallest, Subminuette (minutes) to Grand Supercycle (multi-century). The other six degrees of waves were added later when a further study was made. The idea is that the waves of the cycle subdivide into Primary waves, which then subdivide into intermediate waves, and so on. The waves that make up the smaller degree of trend become the building block for the pattern at the next higher wave degree.
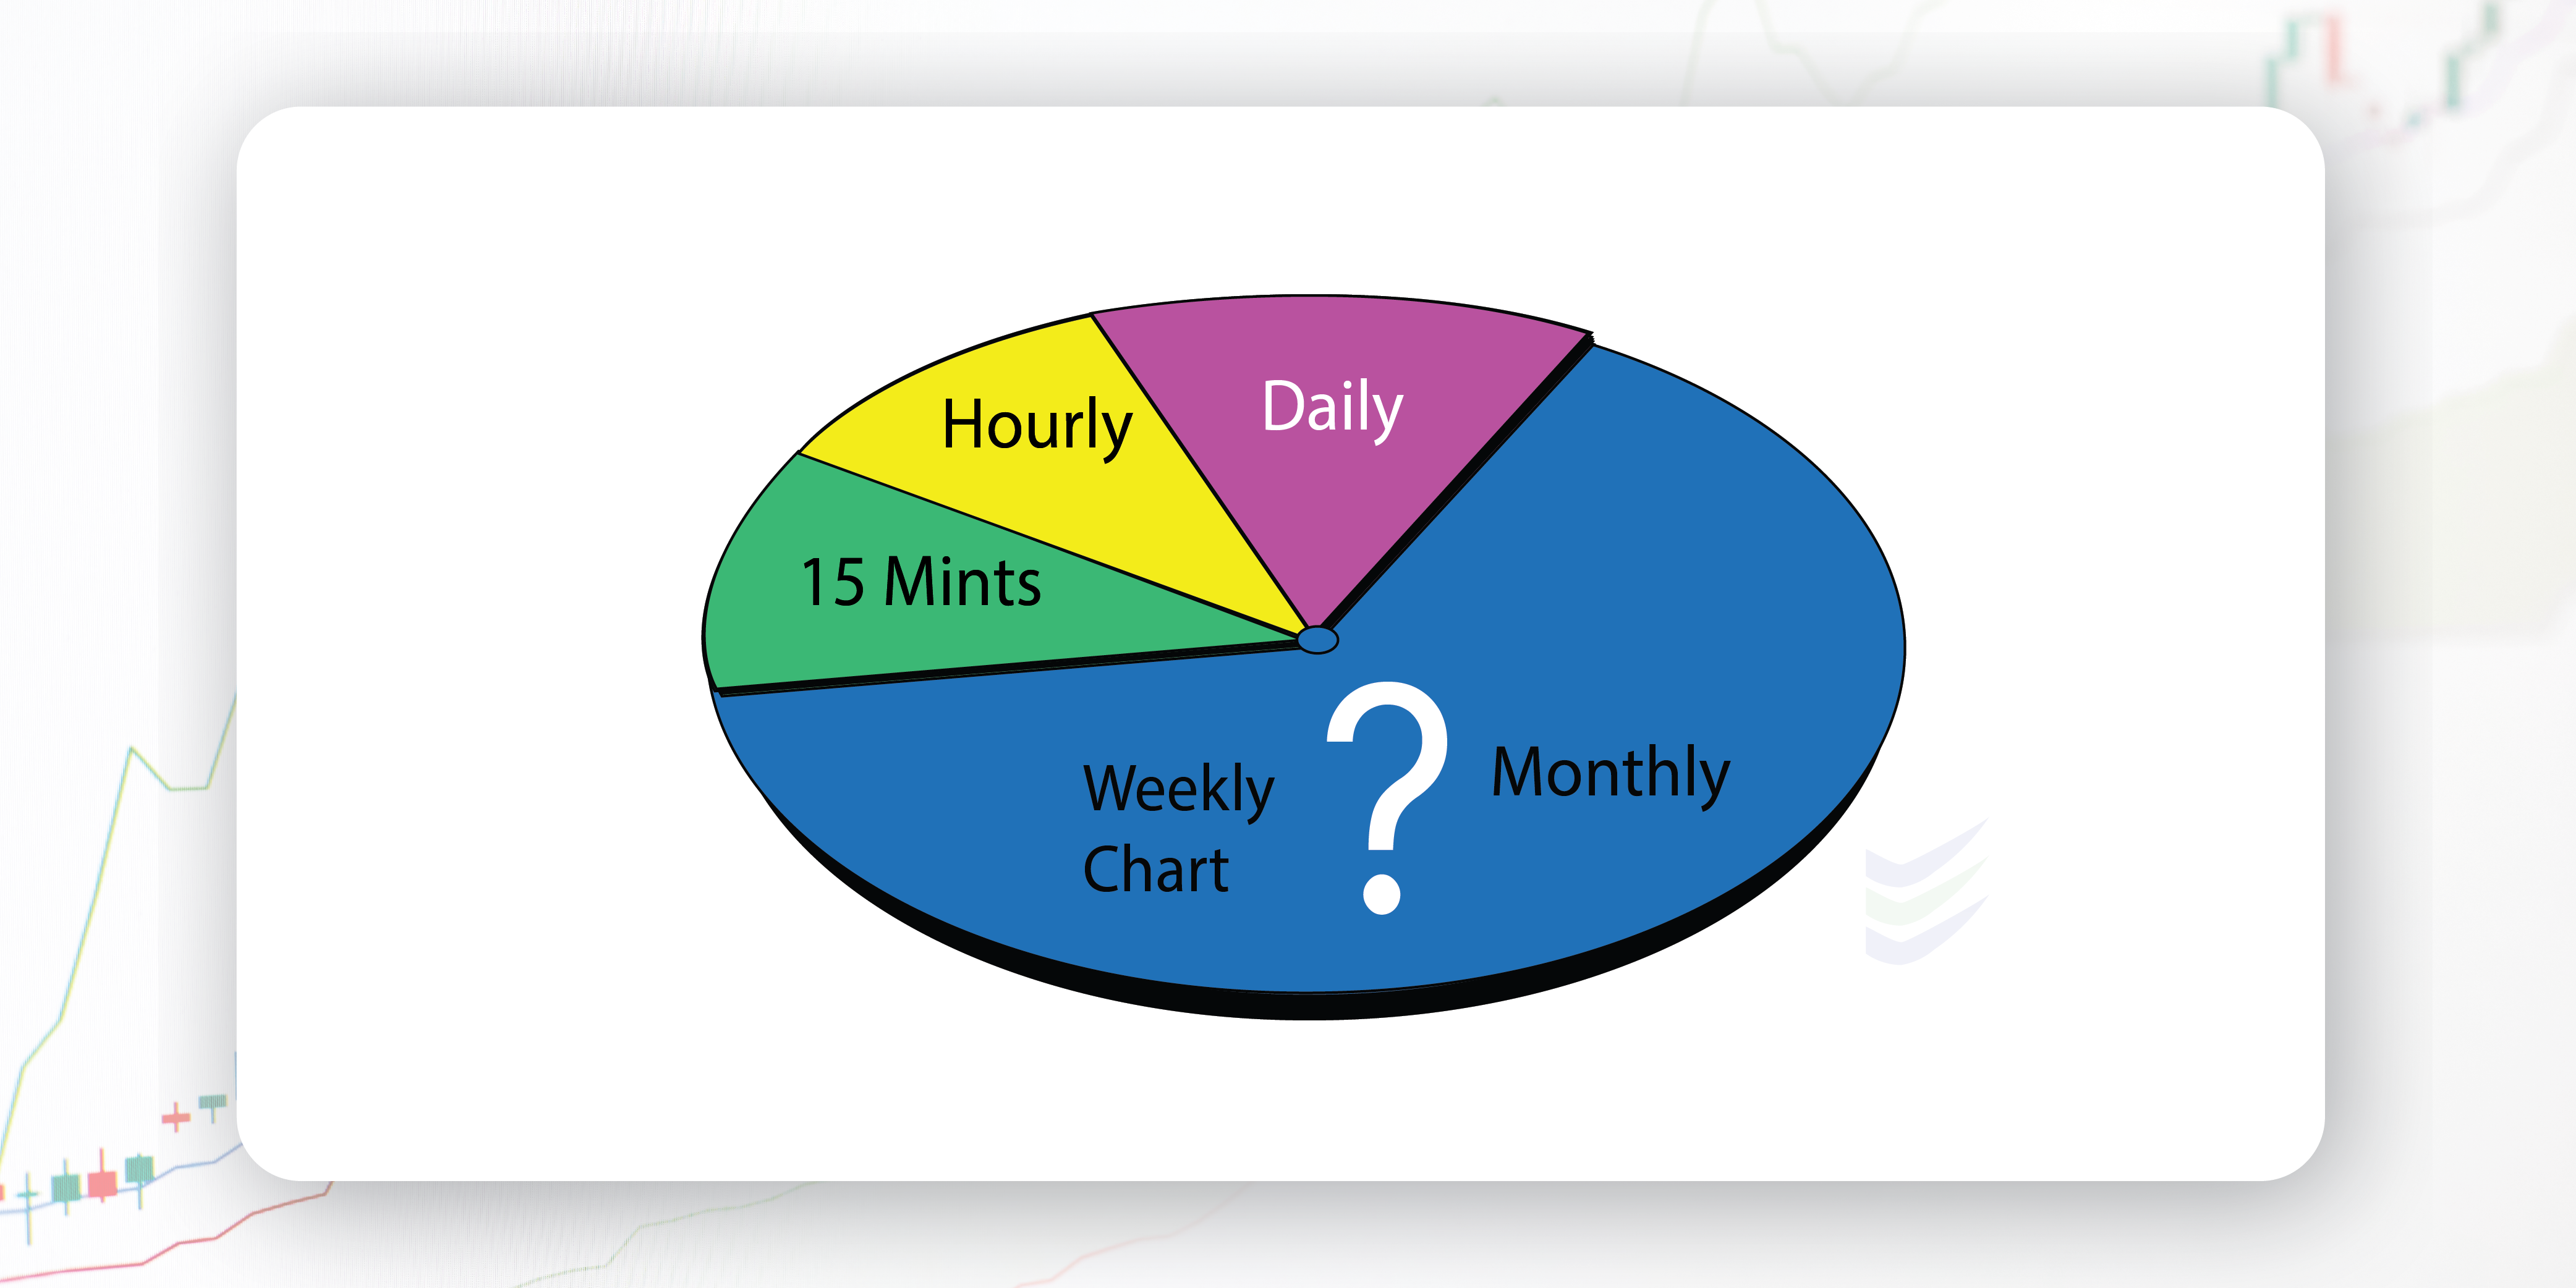
Elliott wave time frame
The Elliott Wave Principle is established on a repeating 9-wave cycle. The cycles will exercise the time frames, including five-minute or monthly, weekly, yearly, and any actively traded market, commodity futures, stocks, indexes, and mutual funds.
Elliott Wave Analysis
Analyzing market charts using Elliott Wave Theory involves identifying and labelling waves based on their characteristics. It's important to note that this analysis can be subjective, and interpretations may vary among analysts. Nevertheless, some key principles guide this analysis:
Elliott Wave Count: Determining where the market is within its cycle.
Wave Relationships: Understanding the proportion and relationship between waves.
Fibonacci Ratios: Using Fibonacci retracement and extension levels to identify potential reversal and target points.
Divergence and Confirmation: Employing other technical indicators to validate Elliott Wave analysis.
Elliott Wave Concepts
Impulse Trend: It normally spreads out in five waves. Five-wave impulse trends usually are made in the direction of the more significant degree trend.
Counter-Trend: It typically spreads out in three waves. A counter-trend is a correction to the prior impulse trend.
Waves of Similar Degree: This is also known as swings of a similar degree. They serve as subdivisions that form a completed structure. Waves of similar degree: This is also known as swings of a similar degree.
Subdivisions of a Wave: Any given wave may subdivide into smaller degree waves to complete the structure of the wave. For Example, Wave-1 of a five-wave impulse trend usually subdivides into five waves of a lesser degree.
We need to know how each wave of a trend or counter-trend commonly subdivides.
Elliott Multiple Time Frames
R.N.Elliott strategized to acknowledge multiple degrees of the wave structure. When the subdivisions of a wave are complete, the more significant degree wave is also complete.
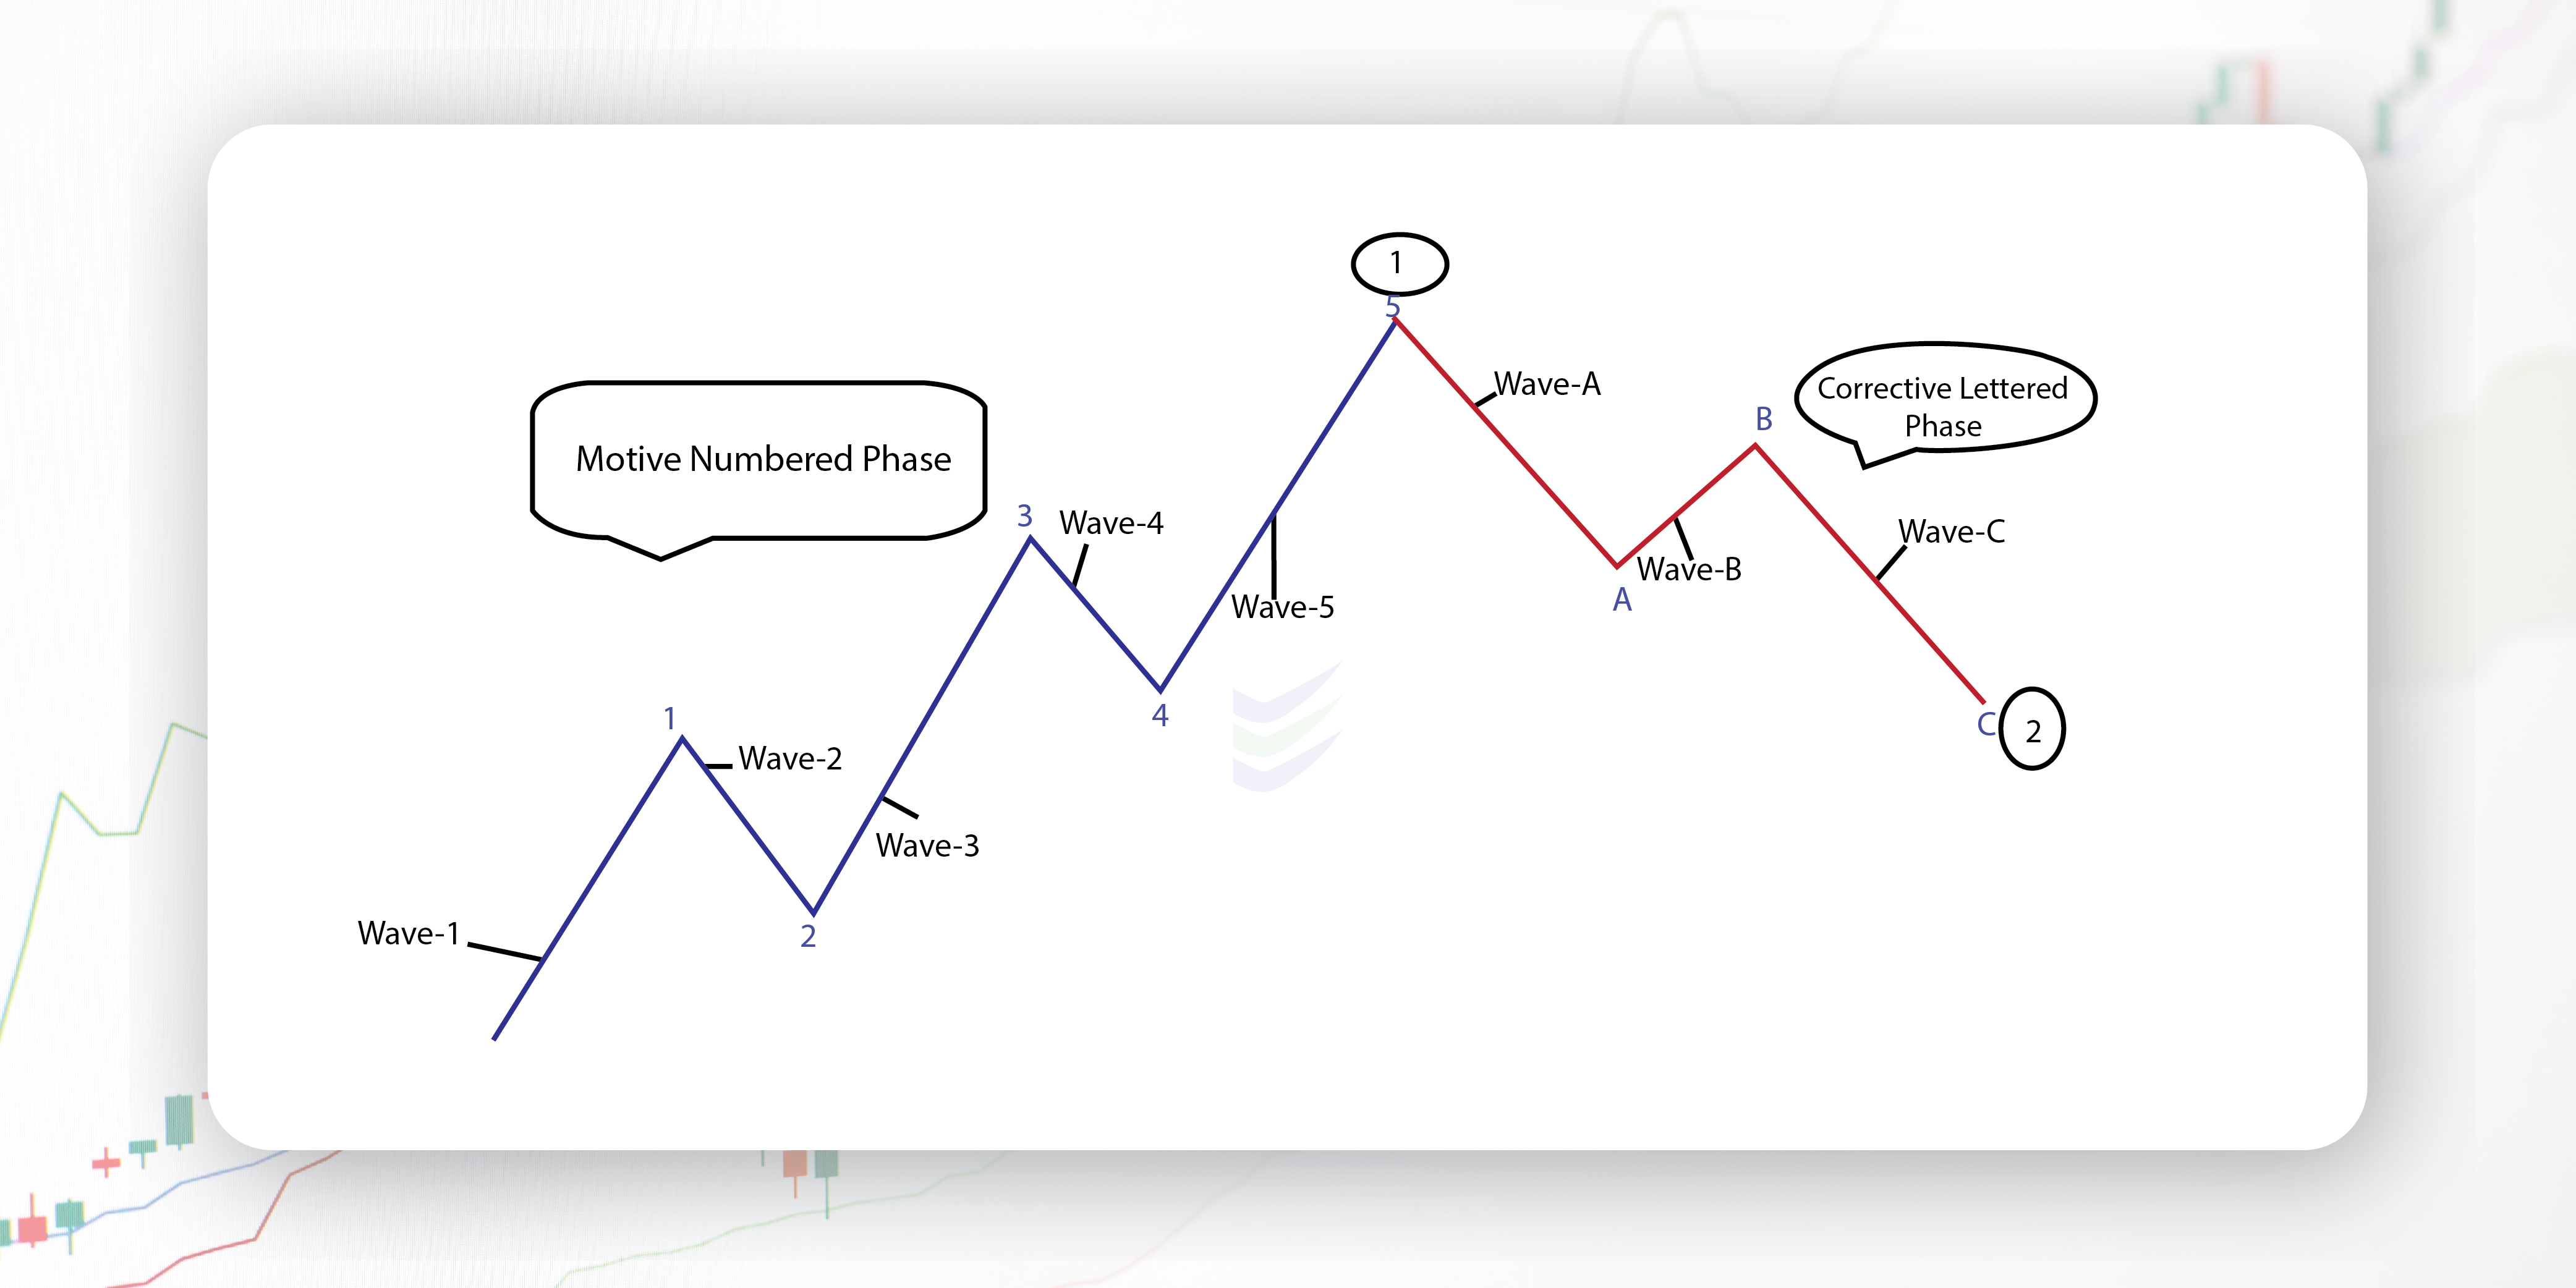
Pictorial representation of the Elliott Wave Theory.
1, 3, and 5 are impulses, and waves 2 and 4 are smaller retraces of waves 1 and 3.
Corrective waves subdivide into three smaller-degree waves; 5-A, A-B, and B-C.
Any move can be observed as one complete Elliot Wave Cycle.
Trend or Counter-trend
Wave Numbers
Number of Waves at Each Degree
Impulse + Correction = Cycle
Largest waves 1+1=2
Largest subdivisions 5+3=8
Next subdivisions 21+13=34
Next subdivisions 89+55=144
|
Motive + (Impulse) |
Corrective + (Zigzag) |
= Cycle |
|
|
Largest waves |
1 |
1 |
2 |
|
Largest subdivisions |
5 |
3 |
8 |
|
Next subdivisions |
21 |
13 |
34 |
|
Next subdivisions |
89 |
55 |
144 |
Elliott Wave Chart Patterns
Elliot Theory also encompasses specific chart patterns that can provide valuable insights into market behaviour.
How Does It Look?
Elliott Wave chart patterns appear as a series of numbered waves and letters, with impulsive and corrective waves clearly defined.
The above image represents the basic Elliott wave Chart Pattern. The wave 1 to wave 5 indicate Impulsive wave and wave A to wave C indicate Corrective wave. Each wave indicates a mini- trend.
What Does Elliott Wave Cycle Indicate?
These Elliott Wave time cycles indicate the current state of the market cycle, potential trend reversals, and areas of support and resistance.
When To Use Elliott Wave Trading Strategy?
Traders use Elliott Wave strategy as part of their technical Wave analysis trading to make informed trading decisions and identify opportunities
Elliott Wave Trading Principles & Elliott Wave Trading Strategies
Elliott Wave Trader requires a deep understanding of market psychology and wave patterns. Some essential Elliott Wave principle and Wave strategy include:
Trend Alignment: Trades should align with the dominant trend direction.
Risk Management: Utilize stop-loss orders to manage potential losses.
Validation: Confirm wave counts with additional technical analysis and indicators.
Confluence: Seek confluence between different wave counts and timeframes for higher-confidence trades.
Patience and Discipline: Wait for clear setups and avoid overtrading.
Why Is Pattern Analysis An Important Part Of The Dynamic Trading Approach To Technical Analysis?
To check if a market is in a trend or counter-trend is regulated with the help of elliot wave analysis.The position of the market within a trend or counter-trend is regulated with the help of pattern analysis.The time and price objectives of the current trend or counter-trend are highlighted with the help of pattern analysis.
What Do We Analyze And Implement?
Recognition of Stocks that may follow the Elliot Wave Theory. Invest the money in those stocks when the upward trend these stocks starts. Booking of Profit as the downtrend starts in the stock. The uptrend and downtrend of these stocks are evaluated based on the stock charts, the total market capitalization of the store, and the public interest for that particular stock.Metastock/Ami Broker chart, Fibonacci, and moving averages are considered to evaluate these breakpoints with the help of the software.
Elliott Wave Personality
Wave personality is a sizable expansion of the Wave Principle.It implies joining human personality into the comparison and increasing the service of standard technical analysis.The progression from pessimism to optimism and back again produces similar circumstances at corresponding points in the wave structure. The wave type usually manifests whether the wave is of Grand Supercycle degree or Subminuette. This apprises the analyst what to expect in the following array and one’s current in the progression of waves. As waves are in the process of spreading out, there are times when different wave counts are perfectly justifiable under all Elliott guidelines. At this point that the ability of wave personality can be priceless. If the analyst understands the nature of a single wave, he can interpret the complication of the larger pattern. The following discussions relate to an underlying bull market picture, as illustrated in Figures
The following discussions relate to an underlying bull market picture, as illustrated below figures These observations apply in reverse.

1) First waves: About half of the first waves are part of the "basing" process and thus tend to be rectified by wave two.In contradiction to the bear market rallies within the previous decline, the first wave rise is technically more effective. It mainly shows a slight increase in volume and breadth. Short selling is an indication that the overall trend is down. Investors take advantage of one more rally to sell on. The other fifty per cent of first waves rise from either large bases formed by the previous correction, as in 1949, from downside failures, as in 1962, or from extreme compression, as in 1962 and 1974. From such beginnings, first waves are effective and only backtrack reasonably.
2) Second waves: Second waves backtracks so much from wave one that most of the improvement up to that time is destroyed by the time it ends. This is appropriate for call option purchases, as premiums decline due to anxiety during second waves. Investors believe that the bear market is back to stay. The outcome of second waves is downside non-confirmation and Dow Theory "buy spots," when low volume and volatility indicate a drying up of selling pressure.
3) Third waves: They are solid and broad, and the trend at this point is indisputable. Third waves usually generate the most significant volume and price movement and are often the extended wave in a sequence. It follows, of course, that the third wave of a third wave, and so on, will be the most volatile point of strength in any wave sequence. Such points produce breakouts, "continuation" gaps, volume expansions, exceptional breadth, significant Dow Theory trend confirmations, and runaway price movement, creating large hourly, daily, weekly, monthly or yearly gains in the market, depending on the degree of the wave. Besides the personality of "B" waves, that of third waves produces valuable clues to the wave count as it spreads out.
4) Fourth waves: Fourth waves are forecast in both depth and form because, by alternation, they should differ from the previous second wave of the same degree. They trend sideways, building the base for the final fifth wave move. Lagging stocks build their tops and begin dropping during this wave. This initial decline in the market makes the platform for non-confirmation and slight indications of weakness during the fifth wave.
5) Fifth waves: Fifth waves in stocks are less effective than third waves in terms of breadth. They usually show a slower maximum speed of price change even if a fifth wave is an extension; the rate of price change in the third of the fifth can top that of the third wave. Similarly, while it is common for volume to increase through successive impulse waves at Cycle degree or more extensive, it normally happens below Primary degree only if the fifth wave extends. Sometimes they call for "blowoffs" at the end of long trends, but the stock market has no history of reaching maximum acceleration at a peak. Even if a fifth wave extends, the fifth of the fifth will lack the effectiveness of what preceded it. During the advancement, optimism prevails. Nevertheless, market action does improve relative to prior corrective wave rallies.For instance, the year-end rally in 1976 was unexciting in the Dow. Still, it was nevertheless a motive wave instead of the preceding corrective wave advances in April, July, and September, which, by contrast, had even less influence on the secondary indexes and the cumulative advance-decline line. As a monument to the optimism that fifth waves can produce, the market forecasting services polled two weeks after the conclusion of that rally turned in the lowest percentage of "bears," 4.5%, in the history of the recorded figures despite that fifth waves failure to make a new high!
Ideal Elliott Wave Personality
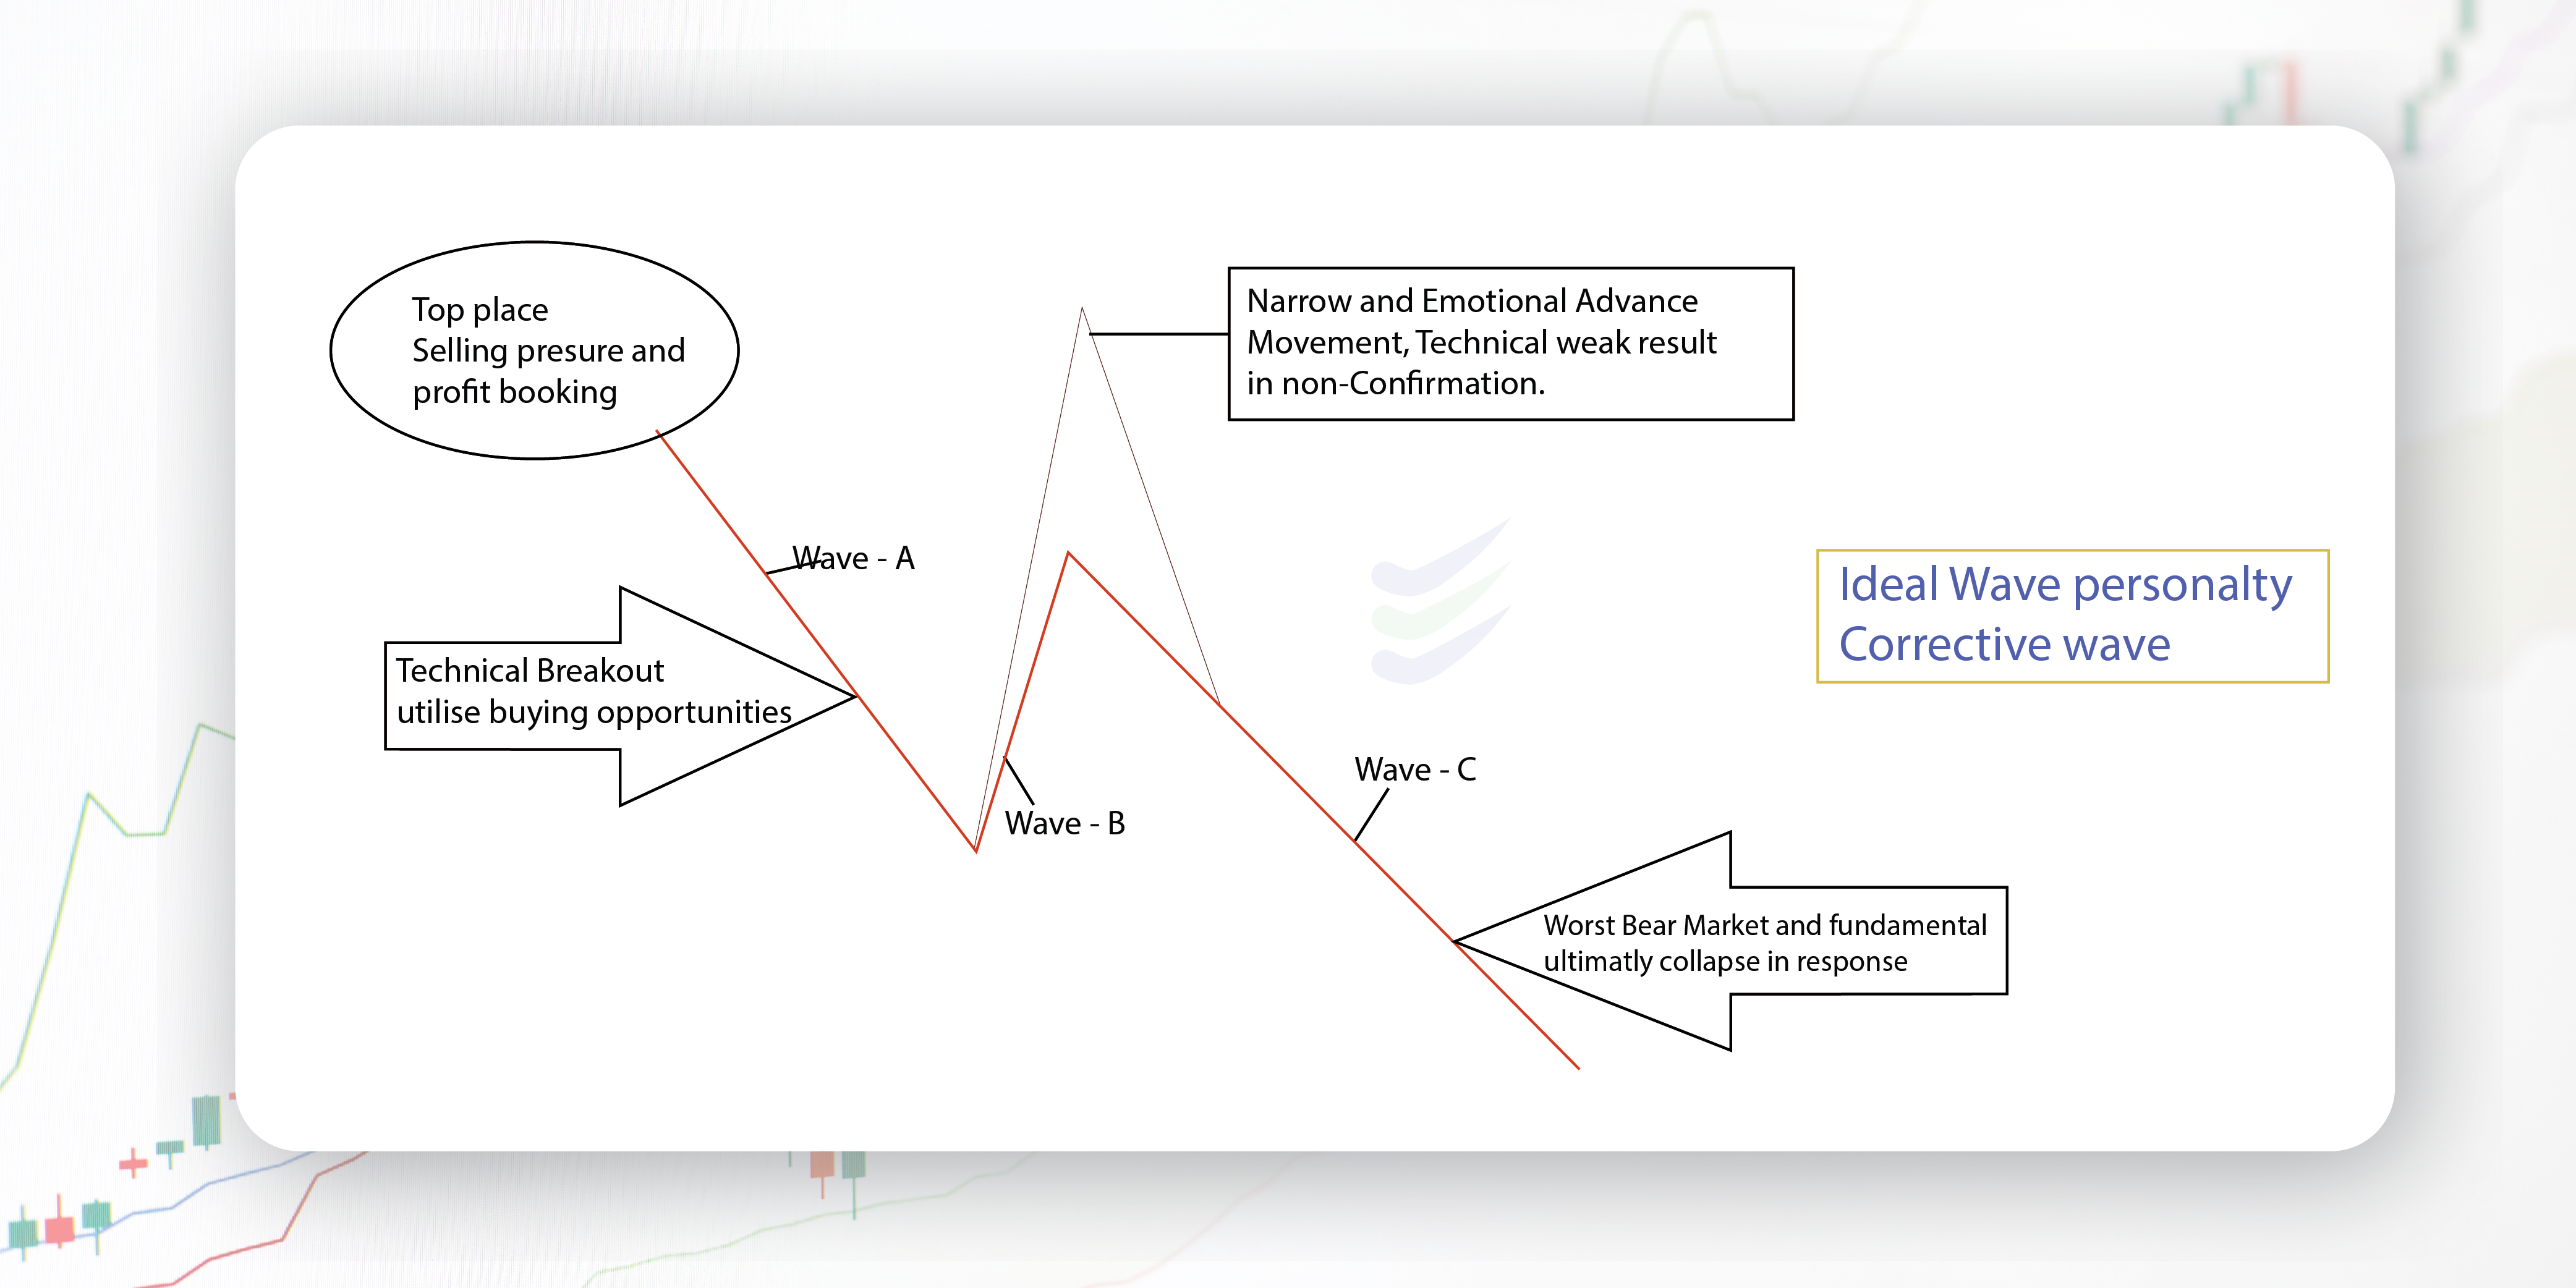
6) "A" waves: During "A" waves of bear markets, investors are convinced that this is just backtracking under the next leg of advance. The "A" wave sets the tone for the "B" wave to follow. A five-wave A indicates a zigzag for wave B, while a three-wave A signals a flat or triangle.
7) "B" waves: "B" waves are phonies. They are sucker plays, bull traps, speculators' paradise, orgies of odd-lottery mentality, or expressions of dumb institutional complacency (or both). They are mostly "unconfirmed" by other averages. They are rarely technically strong and are virtually always doomed to complete retracement by wave C. Chances are it's a "B" wave. "X" waves and "D" waves in expanding triangles, both corrective wave advances, have the exact nature.
8)"C" waves: Declining "C" waves are generally destructive. They are third waves and have most of the characteristics of third waves. The illusion through waves A and B disappear, and fear takes over. "C" waves are persistent and broad. 1930-1932 was a "C" wave. 1962 was a "C" wave. and 1969-1970 and 1973-1974 can be classified as "C" waves. Advancing "C" waves within upward corrections in larger bear markets are practical and can be mistaken for starting a new upswing, especially since they unfold in five waves.
9) "D" waves: "D" waves in all but expanding triangles are often followed by increased volume. D" waves in non-expanding triangles are hybrids, part corrective, yet have some nature of first waves since they follow "C" waves and are not fully retracted. "D" waves, being advances within corrective waves, are as phoney as "B" waves.
The rise from 1970 to 1973 was wave [D] within the large wave IV of Cycle degree. The "one-decision" complacency that characterized the attitude of the average institutional fund manager at the time is well documented. The area of participation again was narrow, this time the "nifty fifty" growth and glamour issues. Breadth and the Transportation Average topped early in 1972 and refused to confirm the highly high multiples bestowed upon the favourite fifty.Washington was inflating at full steam to sustain the illusory prosperity during the entire advance in preparation for the election. As with the initial wave [B], "phoney" was a clear description.
10) "E" waves: "E" waves in triangles appear to be the dramatic start of a new downtrend after a top has been built. They are followed by strongly supportive news, in conjunction with the tendency of "E" waves to show a false breakdown through the triangle boundary line, which intensifies the bearish conviction of market participants when they should be preparing for a move in the opposite direction. "E" waves are ending waves that show up sentimental as that of fifth waves.
Elliott Wave Examples
Let's consider a few examples to illustrate the practical application of Elliott Wave Theory in real-world market analysis:
Example 1: Bullish Trend
In a bullish trend, an analyst might identify a clear five-wave impulsive pattern followed by a three-wave corrective pattern, indicating that the trend is likely to continue.
Example 2: Bearish Reversal
In a bearish reversal scenario, an analyst might observe a five-wave impulsive pattern followed by a three-wave corrective pattern, signalling a potential trend reversal to the downside.
Example 3: Complex Correction
Elliott Wave Theory can also identify complex corrections, where the corrective waves are more intricate, providing traders with insights into market choppiness and uncertainty.
Elliott Wave Theory is a powerful tool for traders and investors looking to gain insights into market behaviour, identify potential trend reversals, and make informed trading decisions. However, successful application of this theory requires practice, continuous learning, and a holistic approach that incorporates other forms of technical and fundamental analysis. By doing so, traders can harness the potential of Elliott Wave Theory to navigate the complexities of financial markets effectively.
Frequently Asked Questions
What is the alternation principle in Elliott Wave Theory?
The alternation principle suggests that if Wave 2 is a simple correction, Wave 4 is likely to be a more complex correction, and vice versa. This principle helps in identifying potential wave patterns.
How can I use Elliott Wave Theory in trading or investing?
Traders and investors use Elliott Wave Theory to make price predictions and identify potential entry and exit points. It's often used in conjunction with other technical analysis tools and indicators for confirmation.
Are there any common mistakes to avoid when using Elliott Wave Theory?
One common mistake is to force-fit wave patterns onto a chart, even when they don't fit well. Overtrading or relying solely on Elliott Wave analysis without considering other factors is another mistake to avoid.
Is Elliott Wave Theory a reliable tool for forecasting market movements?
The reliability of Elliott Wave Theory is a subject of debate among traders and analysts. Some find it to be a valuable tool for understanding market psychology and making predictions, while others consider it subjective and challenging to apply consistently.
What is the NIFTY Elliott Wave SuperCycle?
Nifty Elliott Wave supercycle essentially about applying Elliott Wave Theory to a very long-term chart of the Nifty 50 index. This analysis aims to identify and label supercycle waves (e.g., Wave I, Wave II, Wave III, Wave IV, and Wave V) and their corresponding corrective waves (A, B, C) within the Nifty 50's historical price data.