Wipro vs HCL – A Deep Dive into Q1 FY26 Results
Introduction
The IT-BPM industry continues to be a cornerstone of India’s growth story, accounting for nearly 7.3–7.5% of the nation’s GDP in FY 2023–24. Projections suggest this figure could climb to 10% by 2025 as digital transformation accelerates across industries. In FY 2024, the sector generated around USD 254 billion in total revenue, with USD 194 billion coming from exports (Wikipedia, citing Nasscom).
On the market front, the Nifty IT Index traded near 34,400 in early August 2025, well below its 52-week high of approximately 46,100 (Moneycontrol, Tickertape), reflecting a mixed sentiment among investors. Against this backdrop, IT majors such as Wipro and HCL Technologies continue to shape industry performance and market expectations. This article takes a closer look at their Q1 FY26 results to see how the two stack up against each other.
IT Sector Overview
By 2030, India’s IT sector is projected to reach USD 500 billion in revenue, strengthening its position as a leading force in the global technology market. With a digital competitiveness score of 60/100, the country ranks above all BRICS peers except China—reflecting its expanding tech talent pool and growing international influence.
The Union Budget 2025–26 reinforces this momentum, allocating Rs. 2,000 crore to promote AI and build supporting infrastructure, alongside Rs. 500 crore for a Centre of Excellence in AI for Education to enhance digital skills and transform learning.
Beyond AI, government priorities include cybersecurity, hyperscale computing, and blockchain—sectors expected to shape the next phase of growth. Affordable internet, at roughly Rs. 10 per GB, continues to power digital innovation and widespread adoption across the nation.
Wipro Ltd – Company Overview
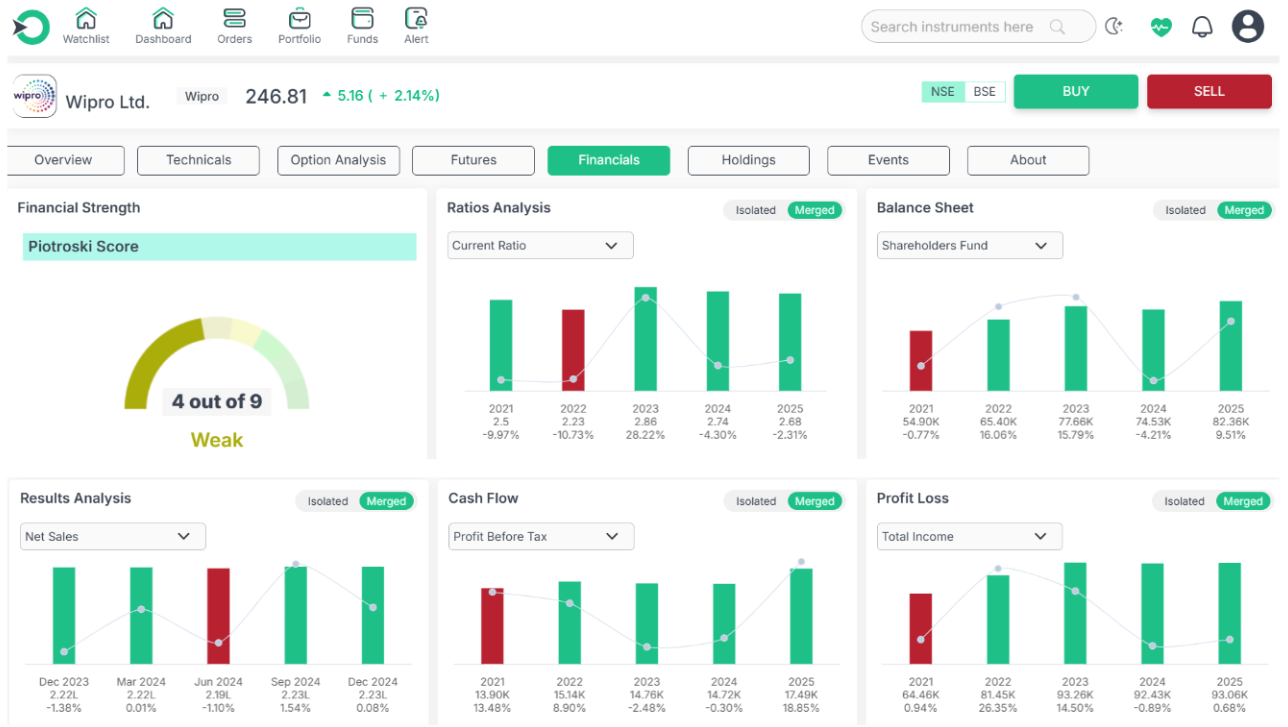
Wipro Limited is a global technology and consulting enterprise that delivers diverse IT solutions and business process services across multiple industries. Its core operations fall under the IT Services segment, catering to diverse industries with tailored digital transformation, cloud, cybersecurity, and analytics solutions.
By March 2025, Wipro had established a strong global footprint, serving over 1,371 active clients across the Americas, Europe, Asia-Pacific, the Middle East, and Africa. For FY25, the company reported a large deal total contract value (TCV) of USD 5.4 billion, underscoring its ability to win significant projects and execute them effectively across multiple sectors.
HCL Technologies – Company Overview
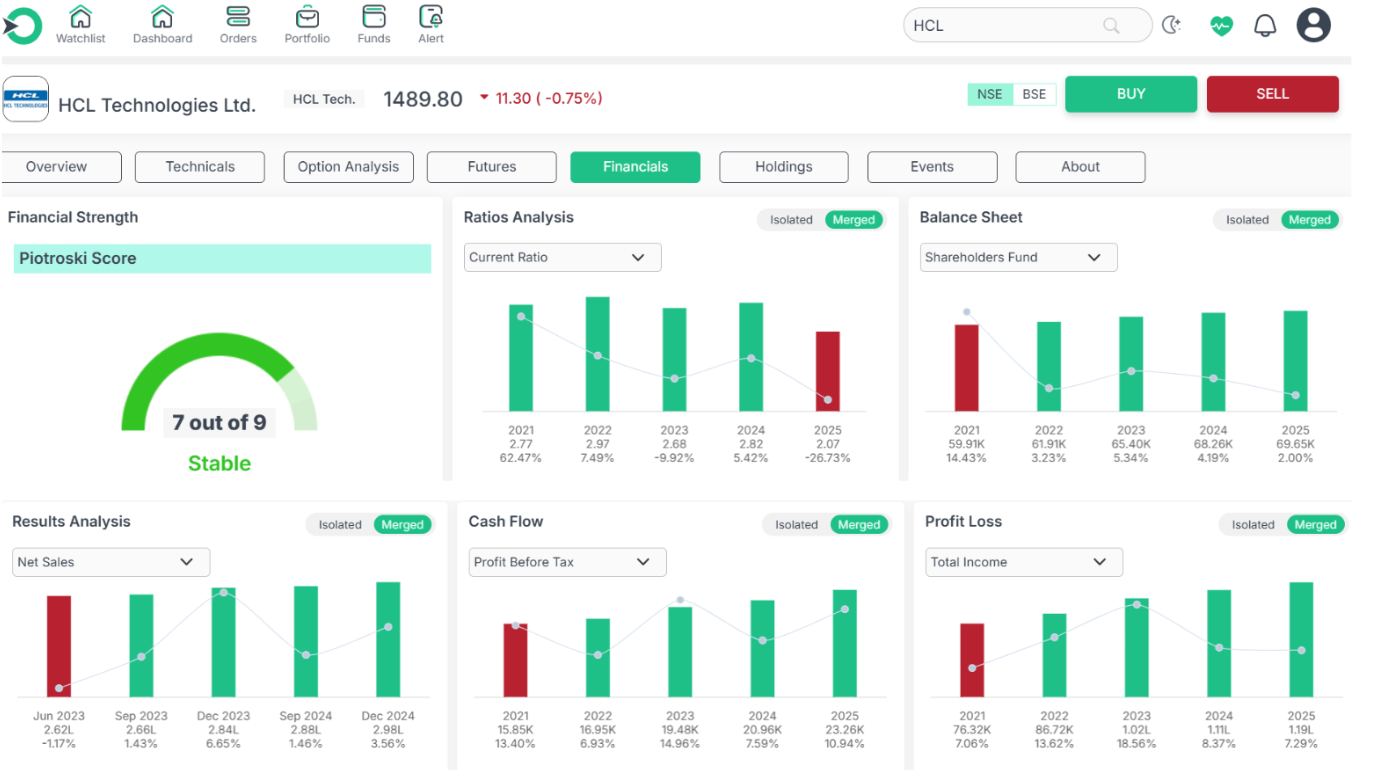
HCL Technologies, which debuted on the stock market in 1999, has evolved into one of the fastest-growing global IT services providers. The company offers a broad suite of solutions, including software-driven IT services, remote infrastructure management, research and development, and business process outsourcing (BPO)—all aimed at driving digital transformation for its clients.
By March 2025, HCL had established its presence in close to 60 nations, supported by a global network of more than 210 delivery centers. Recent strategic moves include a partnership with Western Union to implement an AI-led platform operating model, alongside securing deals for Agentic AI and GenAI-powered process documentation—demonstrating its focus on next-generation technology adoption.
Q1 FY26 Comparative Financial Performance: HCL Technologies vs Wipro (Rs. in Crores)
|
Field |
HCL Tech (Rs. Cr) |
Wipro (Rs. Cr) |
|
Total Revenue/Income |
30,349.00 |
22,134.60 |
|
Cost Of Revenue |
18,106.00 |
15,724.70 |
|
Gross Profit |
12,243.00 |
6,409.90 |
|
Total Operating Expense |
24,314.00 |
17,901.50 |
|
Selling, General & Administrative Expenses |
17,598.00 |
2,693.20 |
|
Other Operating Expenses |
6,261.00 |
13,679.80 |
|
Selling & Marketing Expenses |
— |
1,528.50 |
|
Research & Development |
455 |
0 |
|
Depreciation & Amortization |
1,093.00 |
685.5 |
|
Operating Income/Profit |
4,942.00 |
4,233.10 |
|
Interest Income |
209 |
834 |
|
Total Other Income (Expense) Net |
247 |
332.2 |
|
EBITDA |
6,490.00 |
5,298.50 |
|
Reconciled Depreciation |
1,093.00 |
685.5 |
|
EBIT |
5,397.00 |
4,613.00 |
|
Interest Expense |
209 |
360.8 |
|
Income/Profit Before Tax |
5,189.00 |
4,253.30 |
|
Income Tax Expense |
1,345.00 |
921.8 |
|
Tax Provision |
1,345.00 |
921.8 |
|
Net Income from Continuing Operations |
3,844.00 |
3,331.50 |
|
Net Income |
3,843.00 |
3,330.40 |
|
Net Income Applicable to Common Share |
3,843.00 |
3,330.40 |
|
EPS (Earnings Per Share) |
14.18 |
3.18 |
Revenue
During Q1 FY26, HCL Technologies generated ?30,349 crore in operating revenue, marking a modest uptick compared to ?30,246 crore in the prior quarter. This stability reflects the company’s ability to maintain growth momentum despite broader macroeconomic challenges. Wipro, in comparison, posted revenue of Rs. 22,134.6 crore, slightly lower in constant currency terms compared to previous periods. The difference of over Rs. 8,200 crore in revenue between the two companies demonstrates HCL Tech’s significantly larger operational scale and broader service delivery capacity in the market.
EBITDA
In the recent quarter, HCL Technologies posted an EBITDA of Rs. 6,490 crore, powered by effective operational strategies and a well-rounded performance from its multiple business verticals. Wipro recorded an EBITDA of Rs. 5,298.5 crore, maintaining a healthy IT services operating margin of 17.3% despite revenue pressures. Although HCL Tech reported a higher absolute EBITDA by Rs. 1,191 crore, Wipro demonstrated robust margin retention, highlighting its effective cost control and operational discipline.
EBIT (Operating Income)
HCL Technologies delivered an EBIT of Rs. 5,397 crore, driven by consistent performances in IT and Business Services, Engineering & R&D, and HCL Software. Wipro’s EBIT was Rs. 4,613 crore, indicating solid operational control but reflecting its smaller revenue base. HCL Tech’s higher EBIT underscores its advantage in converting revenue into operating profit, which is further amplified by its diversified business portfolio.
Net Profit
HCL Technologies registered a net profit of Rs. 3,844 crore this quarter, reflecting stable earnings performance with only slight changes relative to earlier periods. Wipro’s net profit for the same period was Rs. 3,330.4 crore. While this figure is lower than HCL Tech’s in absolute terms, it represents a 10.9% year-on-year increase for Wipro, highlighting improved cost efficiencies and stronger bottom-line performance despite softer revenue trends.
Earnings Per Share (EPS)
HCL Technologies delivered an EPS of Rs. 14.18 this quarter, underlining its robust profit generation and the strength of its financial foundation. Wipro’s EPS was Rs. 3.18, which, although significantly lower in absolute value, marked a 10.8% year-on-year improvement. Wipro’s rise in EPS reflects its higher net profit and signals meaningful advancement in generating value for its shareholders.
Dividends
Shareholder returns were higher from HCL Technologies, which declared an interim dividend of Rs. 12 per share for the quarter, in line with its consistent dividend distribution policy. Wipro Ltd announced an interim dividend of Rs. 5 per share, taking a more conservative payout approach in comparison.
Cost Structure
HCL Technologies’ largest cost component was employee benefits expense at Rs. 17,598 crore, reflecting the scale of its workforce and talent-intensive service model. Wipro’s cost of revenue amounted to Rs. 15,724.7 crore, which, relative to its revenue size, implies a higher proportion of direct costs and consequently a tighter gross margin. These cost structures play a significant role in influencing each company’s profitability margins.
Strategic Positioning
HCL Technologies’ performance benefited from its diversified revenue streams across IT and Business Services, Engineering & R&D, and HCL Software, offering resilience against volatility in individual segments. Wipro, while more concentrated in IT services, recorded an exceptional 131% year-on-year growth in large deal bookings to $2.7 billion, suggesting a strong pipeline for potential revenue growth in upcoming quarters.
Stock Performance Details (as of 10 August 2025)
-
Wipro’s stock is priced at Rs. 239.33, with its highest value over the past year reaching Rs. 324.60 and the lowest dipping to Rs. 228.00. Currently, the share is trading nearly 26% under its year-high, highlighting the ongoing valuation headwinds faced by the sector.
-
HCL Technologies: Share price at Rs. 1,476.30, compared to a 52-week high of Rs. 2,012.20 and a 52-week low of Rs. 1,302.75. This places the stock approximately 27% below its peak, aligning with broader IT sector market trends.
Wipro vs HCL Technologies: Comparative Returns Over Multiple Timeframes
The table below presents a comparison of Wipro Ltd and HCL Technologies Ltd’s short- and long-term returns over various periods.
|
Returns |
Wipro Ltd |
HCL Technologies Ltd |
|
1 Month |
4.82% |
5.71% |
|
6 Months |
-15.36% |
-13.07% |
|
1 Year |
9.31% |
21.56% |
|
5 Years |
134.22% |
200.03% |
Over multiple timeframes, HCL Technologies has consistently delivered stronger returns than Wipro, particularly over the long term—nearly doubling in value over the past five years.
Bottom Line
Both HCL Technologies and Wipro delivered notable performances in Q1 FY26, each showcasing distinct strengths. HCL Technologies demonstrated a larger operational scale and strong absolute earnings, while Wipro recorded healthy year-on-year profit growth and secured significant large-deal wins, reflecting operational resilience. In terms of stock performance, both companies are currently trading below their respective 52-week highs, in line with broader sector trends. Ultimately, each presents its own investment considerations, and any decision should be based on an investor’s objectives, market outlook, and risk tolerance rather than a direct comparison of short-term results.
Turn your market insights into action with Enrich Money. Open an AMC FREE DEMAT ACCOUNT and trade efficiently across top IT stocks like Wipro and HCL Technologies.
Frequently Asked Questions
-
How have Wipro and HCL Technologies’ stocks performed recently?
As of 10 August 2025, both companies’ stocks are trading around 26–27% below their 52-week highs.
-
How can I invest in companies like Wipro and HCL Technologies?
You can open an AMC FREE DEMAT ACCOUNT with Enrich Money to trade efficiently in top IT stocks.
-
How did HCL Technologies perform in the latest quarter?
HCL Technologies maintained steady growth with strong revenue generation in its latest quarterly results.
-
How did Wipro’s profitability perform during this quarter?
Wipro delivered solid profitability, showing improvement in year-on-year earnings despite market challenges.
-
What trends are shaping the future of the IT sector?
Emerging technologies like AI, cloud computing, cybersecurity, and blockchain are influencing service offerings and market growth.
Disclaimer: This blog is dedicated exclusively for educational purposes. Please note that the securities and investments mentioned here are provided for informative purposes only and should not be construed as recommendations. Kindly ensure thorough research prior to making any investment decisions. Participation in the securities market carries inherent risks, and it's important to carefully review all associated documents before committing to investments. Please be aware that the attainment of investment objectives is not guaranteed. It's important to note that the past performance of securities and instruments does not reliably predict future performance.