Strategic Insights: Best 5 Mid Cap Stocks for 2024

Overview
In the dynamic landscape of Indian Stock Market, Mid cap stocks stand out as a stock that has a full potential to develop into a large cap company. Being moderately volatile in nature , mid cap stocks is a blend of both opportunities (good return ) and challenges (moderate risk) for the investors.
Mid Cap Stocks are listed companies that have a market capitalization between Rs.5000 crores and Rs.20000 crores. They represent mid capitalization stocks that are larger than small cap stocks and comparatively smaller than large cap stocks.
Also, stocks can be classified as mid cap stocks when the listed company’s overall ranking ranges between 101st to 250th in the stocks exchange indices like Nifty and Sensex. In Nifty Index, the mid market cap stocks are listed based upon their performance as Nifty Midcap150, Nifty Midcap 50, Nifty Midcap Select and Nifty Midcap 100. These benchmark indices provide the list of mid cap companies in NSE. As the mid cap stocks is a mix of both good return and moderate risk has become the investors to generate a diversified portfolio.
In this article, lets understand the considerations for investment in mid cap stocks and top 5 mid cap stocks to invest in 2024.
Considerations to select Mid Cap Stocks for investments:
1. Financial Health:
The mid cap stocks should possess strong fundamentals .
2. Growth:
The mid cap stocks should display positive and increasing revenue and earnings growth.
The mid cap share should possess positive operating and gross margins. positive earnings, low debt and higher liquidity.
3. Management Quality:
The mid cap stocks management should be capable enough to expand to the large stock.
4. Competitive Advantage:
Mid cap stocks should possess the quality of innovation , diversification , ready to change and able to provide products and services at competitive prices.
5. High-Margin Businesses:
Sustainable margin and operational efficiency are essential .
Top 5 Mid-Cap Stocks to invest in 2024
Below is the list of mid cap stocks that are worth investing in 2024.
|
Company Name |
Industry |
CMP |
Market Capitalization (INR Crores) |
|
Other Financial Services |
Rs.3160.05 |
Rs.10,520 |
|
|
Commodity Chemicals |
Rs.2215.00 |
Rs.28,269 |
|
|
Other Electrical Equipment |
Rs.5314.95 |
Rs.52,181 |
|
|
Healthcare Facilities |
Rs.1282.60 |
Rs.17,666 |
|
|
Other Financial Services |
Rs 4903.55 |
Rs.27,072 |
Let’s analyse the top mid cap stocks in detail based on their fundamentals, price movements and technical.
Key Indicators of Top Mid Cap Stocks in 2024
|
Company Name |
Computer Age Management Services Ltd. |
Deepak Nitrite Ltd. |
Polycab India Ltd. |
Narayana Hrudyalaya Ltd. |
CRISIL Ltd. |
|
Industry |
Other Financial Services |
Commodity Chemicals |
Other Elect.Equip./ Prod. |
Healthcare Facilities |
Other Financial Services |
|
CMP as on Mar 26, 2024 |
Rs. 2,831.85 |
Rs. 2,100.05 |
Rs. 4,744.35 |
Rs. 1,197.60 |
Rs. 4,994.50 |
|
Market Capitalization (Rs crore) |
10,520 |
28,269 |
52,181 |
17,666 |
27,072 |
|
Net Worth (Rs crore) |
617 |
3,338 |
5,509 |
1,485 |
1,759 |
|
Price/Earnings Ratio |
39 |
29 |
39 |
45 |
40 |
|
Dividend Yield (%) |
1.67 |
0.31 |
0.59 |
0.13 |
1.57 |
|
Debt/Equity Ratio |
0 |
0.09 |
0.02 |
0.37 |
0 |
|
Return on Equity (%) |
51 |
38 |
17 |
27 |
34 |
|
Return on Capital Employed (%) |
67 |
45 |
22 |
27 |
44 |
|
Operating Profit Margin (%) |
49 |
24 |
11 |
19 |
31 |
|
3 Years Sales CAGR |
9 |
36 |
15 |
9 |
17 |
|
3 Years Net Profit CAGR |
29 |
83 |
19 |
79 |
18 |
|
Inventory Turnover Ratio |
- |
14.07 |
5.83 |
69.04 |
- |
Computer Age Management Services Ltd.
Computer Age Management Services Ltd., operates in the business of depository services as a mutual fund transfer agency. It provides services to Indian private equity funds, banking and NBFC’s. The company headquartered in Chennai, Tamil Nadu and was listed in the stock exchange from the year 2020.
Intraday Price Analysis
|
Computer Age Management Services Ltd as on 5th April, 2024 |
||||
|
Current Price |
Open Price |
Today High |
Today Low |
|
|
Rs.3160.05 |
Rs.3140 |
Rs.3175 |
Rs.3120 |
|
Monthly Price Analysis
|
Date |
Open |
High |
Low |
Close* |
Volume |
|
Apr 05, 2024 |
3,140.00 |
3,175.00 |
3,120.00 |
3,146.75 |
2,08,143 |
|
Mar 31, 2024 |
2,954.00 |
3,225.00 |
2,942.05 |
3,140.35 |
21,27,721 |
|
Feb 29, 2024 |
3,099.00 |
3,149.90 |
2,707.10 |
2,915.65 |
47,78,209 |
|
Feb 16, 2024 |
12 Dividend |
||||
|
Jan 31, 2024 |
2,933.75 |
3,242.00 |
2,776.65 |
3,072.10 |
81,69,670 |
|
Dec 31, 2023 |
2,659.00 |
2,934.85 |
2,643.30 |
2,897.00 |
55,00,005 |
|
Nov 30, 2023 |
2,820.00 |
2,988.00 |
2,618.05 |
2,651.40 |
95,32,137 |
|
Nov 17, 2023 |
10 Dividend |
||||
|
Oct 31, 2023 |
2,258.95 |
2,935.00 |
2,230.00 |
2,801.15 |
78,93,592 |
|
Sep 30, 2023 |
2,510.55 |
2,639.00 |
2,240.00 |
2,246.90 |
27,67,082 |
|
Aug 31, 2023 |
2,376.00 |
2,667.90 |
2,351.00 |
2,510.55 |
30,84,097 |
|
Aug 14, 2023 |
20 Dividend |
||||
|
Jul 31, 2023 |
2,368.95 |
2,545.20 |
2,305.00 |
2,375.45 |
33,05,536 |
|
Jun 30, 2023 |
2,238.00 |
2,392.80 |
2,220.15 |
2,356.95 |
26,52,622 |
|
May 31, 2023 |
2,216.90 |
2,265.00 |
2,132.00 |
2,198.55 |
13,06,383 |
|
Apr 30, 2023 |
2,061.25 |
2,225.00 |
2,040.05 |
2,216.90 |
19,75,322 |
The company has paid dividend three times within a period of 12 months.

On analysis of Computer Age Management Services Ltd.’s monthly price data, it is inferred that the stock displays Bullish Initiation Heikin Ashi Pattern formed indicating strong bullish monthly signals
Fundamental Analysis
The mid cap stock valuation displays hike in book value over the period of last three years. But the mid cap stock seems to be over priced than its book value. Indicated in its price to earnings ratio of 47.44 and price to book ratio of 19.80.
The profitability of the mid cap stock is overall seeming to be good with excellent net margin for the past three years , outstanding return on equity and assets. RoCE of 36.41. The mid cap stock has also generated excessive return through its earnings.
The growth aspects of the mid cap stock are medium with increase in trend in total sales and net profit . Annual and quarterly sales of the stock have increased over the last three years period.
The mid cap stock has exhibited excellent stability by settling more than 50% of its debt and the company is working towards being debt free. The mid cap stock has maintained cash ratio of 3.29.
Technical Analysis
Indicators
As per Orca’s technical indication, the momentum of Computer Age Management Services Ltd.is given below
|
Type |
Value |
Momentum |
|
RSI |
58.78 |
Neutral |
|
CCI |
87.58 |
Bearish |
|
Williams_R |
15.77 |
Bearish |
|
UO |
51.03 |
Neutral |
|
Rate of Change |
3.82 |
Bullish |
|
MACD |
-709.53 |
Bearish |
Moving Averages
|
Day |
SMA |
EMA |
|
5 |
3110.25 |
3116.73 |
|
50 |
2933.652 |
2944.18 |
|
200 |
2581.96 |
2660.69 |
Inference
-
The simple and exponential moving average displays strong bullish uptrend for all the time periods.
-
SMA & EMA Moving Averages Crossovers indicate there are strong bullish signals for all the time periods.
Pivot Levels
|
Standard Pivot Levels of Computer Age Management Services Ltd. as on 5th April, 2024 |
||||||
|
S3 |
S2 |
S1 |
Pivot |
R1 |
R2 |
R3 |
|
3043.23 |
3080.12 |
3110.23 |
3147.12 |
3177.23 |
3214.12 |
3244.23 |
Deepak Nitrite Ltd.
Deepak Nitrite Limited ,operates in the business of manufacturing and sales of chemicals-based products and phenolics. The mid cap stock exports its products to various countries. The company is headquartered in Gujarat and was listed on the stock exchange from the year 1971.
Intraday Price Analysis
|
Deepak Nitrite Ltd as on 5th April, 2024 |
||||
|
Current Price |
Open Price |
Today High |
Today Low |
|
|
Rs.2219.90 |
Rs.2216.95 |
Rs.2222.75 |
Rs.2187.20 |
|
Monthly Price Analysis
|
Date |
Open |
High |
Low |
Close* |
Volume |
|
Apr 05, 2024 |
2,216.95 |
2,222.75 |
2,187.20 |
2,219.90 |
3,14,882 |
|
Mar 31, 2024 |
2,131.95 |
2,230.75 |
2,120.00 |
2,214.45 |
17,07,979 |
|
Feb 29, 2024 |
2,206.15 |
2,250.00 |
2,035.10 |
2,125.50 |
35,62,790 |
|
Jan 31, 2024 |
2,350.00 |
2,378.00 |
2,163.00 |
2,212.85 |
58,51,422 |
|
Dec 31, 2023 |
2,488.00 |
2,521.15 |
2,208.05 |
2,305.90 |
57,39,700 |
|
Nov 30, 2023 |
2,209.00 |
2,502.00 |
2,179.40 |
2,481.20 |
1,27,35,139 |
|
Oct 31, 2023 |
1,988.00 |
2,239.80 |
1,955.05 |
2,196.10 |
67,22,501 |
|
Sep 30, 2023 |
2,120.45 |
2,167.85 |
1,921.85 |
1,986.75 |
52,57,449 |
|
Aug 31, 2023 |
2,233.05 |
2,372.70 |
2,082.20 |
2,120.45 |
75,67,823 |
|
Jul 31, 2023 |
2,010.70 |
2,232.35 |
1,938.25 |
2,220.00 |
1,31,62,691 |
|
Jul 27, 2023 |
7.5 Dividend |
||||
|
Jun 30, 2023 |
2,174.35 |
2,202.70 |
1,900.20 |
2,010.70 |
92,60,799 |
|
May 31, 2023 |
2,081.95 |
2,282.10 |
2,002.10 |
2,173.75 |
1,07,74,616 |
|
Apr 30, 2023 |
1,888.20 |
2,160.00 |
1,863.65 |
2,073.80 |
1,24,77,165 |
The company has paid dividend one time within a period of 12 months.
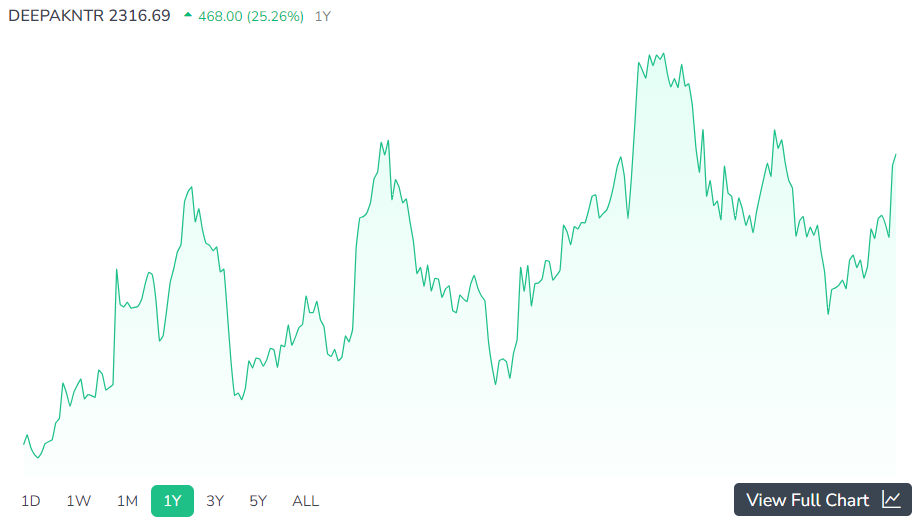
On analysis of Deepak Nitrite Limited’s monthly price data, it is inferred that the stock displays Bullish Initiation Heikin Ashi Pattern formed indicating strong bullish monthly signals
Fundamental Analysis
The mid cap stock valuation displays increase in book value over the period of last three years. But the price to book ratio indicates that the stock seems to be overprices to 7.36 with poor TSR value of 29.17.
The profitability of the mid cap stock is average with the company stable to achieve good RoE for the past three years. The mid cap stock was able to generate excel return through its corporate earnings. The RoCE if good at 20.56, RoE at 19.28 % and Net margin at 10.52%. The mid cap stock was able to pay dividend once in last 12 months and hence its dividend yield is low at 0.350% .
The growth aspects of the mid cap stock are good with its annual sales and total assets has grown in last three years.
The mid cap stock has exhibited excellent stability with its Altman Z score to be at 21.20 . The mid cap stock is operating towards becoming a debt free company with its debt-to-equity ratio decreasing gradually for the past five years. Mid cap stock’s liquidity has also improved.
Technical Analysis
Indicators
As per Orca’s technical indication, the momentum of Deepak Nitrite Limited is given below
|
Type |
Value |
Momentum |
|
RSI |
50.47 |
Neutral |
|
CCI |
34.90 |
Neutral |
|
Williams_R |
-10.15 |
Bearish |
|
UO |
59.78 |
Neutral |
|
Rate of Change |
0.84 |
Bullish |
|
MACD |
-709.53 |
Bearish |
Moving Averages
|
Day |
SMA |
EMA |
|
5 |
2189.28 |
2196.90 |
|
50 |
2253.67 |
2233.51 |
|
200 |
2174.98 |
2178.79 |
Inference :
-
The simple and exponential moving average displays mild bullish signal mixed with bearish signals.
-
SMA & EMA Moving Averages Crossovers indicate there are mild bullish crossovers for all the time periods.
Pivot Levels
|
Standard Pivot Levels of Deepak Nitrite Ltd. as on 5th April, 2024 |
||||||
|
S3 |
S2 |
S1 |
Pivot |
R1 |
R2 |
R3 |
|
2161.60 |
2174.40 |
2197.15 |
2209.95 |
2232.70 |
2245.50 |
2268.25 |
Polycab India Ltd.
Polycab India Ltd., operates in the business of manufacturing and selling of wires and cables both in India and in other countries. The company headquartered in Nani, Daman and was listed in the stock exchange from the year 2019.
Intraday Price Analysis
|
Polycab India Ltd as on 5th April, 2024 |
||||
|
Current Price |
Open Price |
Today High |
Today Low |
|
|
Rs.5314.95 |
Rs.5226 |
Rs.5323.20 |
Rs.5220 |
|
Monthly Price Analysis
|
Date |
Open |
High |
Low |
Close* |
Volume |
|
Apr 05, 2024 |
5,226.00 |
5,323.30 |
5,220.00 |
5,316.60 |
2,96,294 |
|
Mar 31, 2024 |
5,073.00 |
5,304.90 |
5,073.00 |
5,224.95 |
12,29,844 |
|
Feb 29, 2024 |
4,780.00 |
5,136.30 |
4,635.05 |
5,065.00 |
81,60,170 |
|
Jan 31, 2024 |
4,350.00 |
4,867.60 |
4,236.00 |
4,749.85 |
1,38,21,021 |
|
Dec 31, 2023 |
5,500.00 |
5,530.45 |
3,801.00 |
4,343.15 |
5,32,26,243 |
|
Nov 30, 2023 |
5,344.00 |
5,733.00 |
5,226.10 |
5,484.85 |
95,60,159 |
|
Oct 31, 2023 |
4,922.10 |
5,433.00 |
4,890.80 |
5,267.90 |
1,52,75,934 |
|
Sep 30, 2023 |
5,343.05 |
5,493.65 |
4,811.10 |
4,922.10 |
1,22,02,939 |
|
Aug 31, 2023 |
5,139.75 |
5,398.00 |
4,849.45 |
5,343.05 |
1,10,32,498 |
|
Jul 31, 2023 |
4,844.95 |
5,166.00 |
4,490.75 |
5,123.05 |
1,27,43,113 |
|
Jun 30, 2023 |
3,579.90 |
4,924.00 |
3,491.00 |
4,816.80 |
2,39,02,028 |
|
Jun 21, 2023 |
20 Dividend |
||||
|
May 31, 2023 |
3,450.00 |
3,637.95 |
3,379.75 |
3,551.15 |
72,92,592 |
|
Apr 30, 2023 |
3,205.35 |
3,516.00 |
3,172.15 |
3,423.50 |
86,78,408 |
The company has paid dividend one time within a period of 12 months.
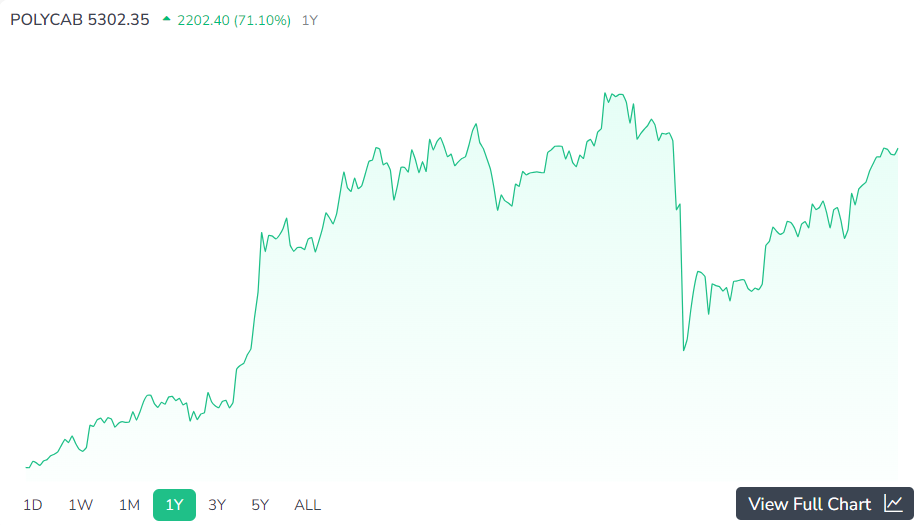
On analysis of Polycab India Ltd.’s monthly price data, it is inferred that the stock displays Bullish Initiation Heikin Ashi Pattern formed indicating strong bullish monthly signals
Fundamental Analysis
The mid cap stock valuation displays increase in its book value for the past three years. With its price to earnings ratio at 47.13 and price to book ratio at 11.35 , indicating that the mid cap stock is overpriced.
The profitability of the mid cap stock is good with mid cap stock has generated excessive return through its corporate earnings. In the last 12 months, the RoE is 24.17% which indicates its profitability strength. Over the past three years, annual net profit and EBITDA has increased, RoE is maintained steadily between 15 -20 and RoCE is 19.03.
The growth aspects of the mid cap stock are good with an uptrend in annual sales, quarterly sales and total assets for the past three years.
The mid cap stock has exhibited excellent stability with Altman Z score at 20.35.
Technical Analysis
Indicators
As per Orca’s technical indication, the momentum of is given below
|
Type |
Value |
Momentum |
|
RSI |
68.60 |
Neutral |
|
CCI |
128.65 |
Bearish |
|
Williams_R |
-0.97 |
Bearish |
|
UO |
64.89 |
Neutral |
|
Rate of Change |
8.21 |
Bullish |
|
MACD |
734.86 |
Bullish |
Moving Averages
|
Day |
SMA |
EMA |
|
5 |
5214.78 |
5214.21 |
|
50 |
4606.60 |
4852.93 |
|
200 |
4753.90 |
4587.68 |
Inference :
-
The simple and exponential moving average displays strong bullish uptrend for all the time periods.
-
SMA & EMA Moving Averages Crossovers indicate there are strong bullish signals for all the time periods.
Pivot Levels
|
Standard Pivot Levels of Polycab India Limited as on 5th April, 2024 |
||||||
|
S3 |
S2 |
S1 |
Pivot |
R1 |
R2 |
R3 |
|
5146.67 |
5183.33 |
5249.97 |
5286.63 |
5353.27 |
5389.93 |
5456.57 |
Narayana Hrudayalaya Ltd.
Narayana Hrudayalaya Limited, provides healthcare services in the country with its headquarters at Bengaluru, India since 2000.
Intraday Price Analysis
|
Narayana Hrudayalaya Ltd as on 5th April, 2024 |
||||
|
Current Price |
Open Price |
Today High |
Today Low |
|
|
Rs.1286.25 |
Rs.1293 |
Rs.1306.90 |
Rs.1276.50 |
|
Monthly Price Analysis
|
Date |
Open |
High |
Low |
Close* |
Volume |
|
Apr 05, 2024 |
1,293.00 |
1,306.90 |
1,276.50 |
1,286.25 |
2,23,395 |
|
Mar 31, 2024 |
1,292.50 |
1,319.90 |
1,280.00 |
1,289.30 |
11,31,323 |
|
Feb 29, 2024 |
1,339.05 |
1,340.20 |
1,175.00 |
1,283.80 |
79,59,628 |
|
Jan 31, 2024 |
1,330.00 |
1,444.90 |
1,303.85 |
1,341.95 |
89,22,832 |
|
Dec 31, 2023 |
1,205.00 |
1,338.00 |
1,147.05 |
1,316.85 |
80,36,176 |
|
Nov 30, 2023 |
1,230.50 |
1,248.00 |
1,152.20 |
1,201.95 |
61,31,775 |
|
Oct 31, 2023 |
1,004.30 |
1,314.10 |
989 |
1,225.60 |
1,05,59,261 |
|
Sep 30, 2023 |
1,085.50 |
1,132.80 |
979.95 |
996 |
42,31,016 |
|
Aug 31, 2023 |
1,049.90 |
1,121.00 |
999.25 |
1,085.50 |
75,88,511 |
|
Jul 31, 2023 |
1,010.50 |
1,050.00 |
973.4 |
1,039.50 |
46,78,533 |
|
Jul 07, 2023 |
2.5 Dividend |
||||
|
Jun 30, 2023 |
994 |
1,068.50 |
981.2 |
1,010.50 |
37,73,271 |
|
May 31, 2023 |
893.5 |
1,076.95 |
891.45 |
993.25 |
93,13,883 |
|
Apr 30, 2023 |
761.85 |
900 |
748.9 |
893.45 |
93,47,732 |
The mid cap stock has paid dividend one time within a period of 12 months.
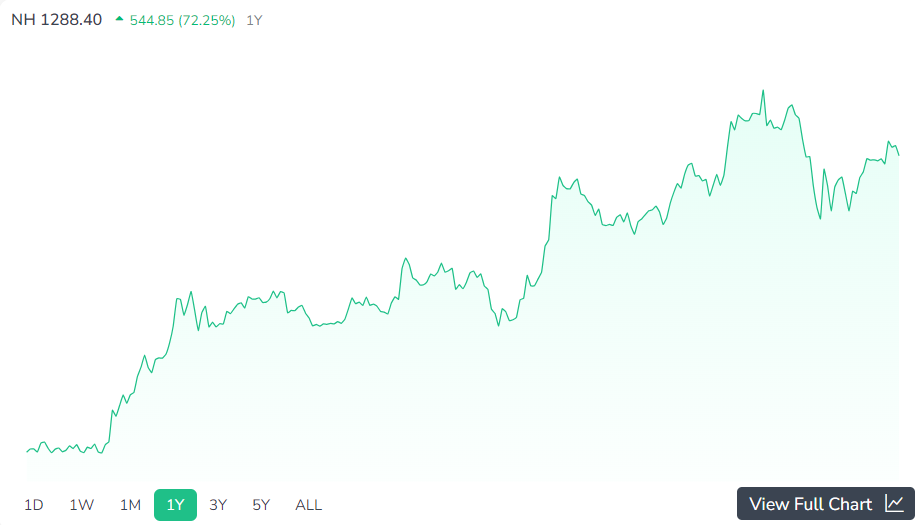
On analysis of Narayana Hrudayalaya monthly price data, it is inferred that the stock displays Bullish Initiation Heikin Ashi Pattern formed indicating strong bullish monthly signals
Fundamental Analysis
The mid cap stock valuation displays great stability with its book value in uptrend for the last three years.
The profitability of the mid cap stock is moderate with its Piotroski F score at 7. The mid cap stock has excessive return from its corporate earnings. The trailing twelve months margin has increased by 15%. Over the past three years, annual net profit, EBITDA has increased. RoE is at 20.97 and Net Margin is at 15.55% . But the dividend yield is very low at 0.2% .
The growth aspects of the mid cap stock are average with its annual sales to be in uptrend for the past three years.
The mid cap stock has exhibited good stability with its Altman Z score at 10.05 . The mid cap stock is heading towards debt free. It is to be noted that the debt-to-equity ratio has reduced for the past five years. The company’s interest coverage ratio is negative at -2.65.
Technical Analysis
Indicators
As per Orca’s technical indication, the momentum of is given below
|
Type |
Value |
Momentum |
|
RSI |
49.20 |
Neutral |
|
CCI |
-0.50 |
Neutral |
|
Williams_R |
-29.17 |
Neutral |
|
UO |
46.28 |
Neutral |
|
Rate of Change |
3.20 |
Bullish |
|
MACD |
-1987.58 |
Bearish |
Moving Averages
|
Day |
SMA |
EMA |
|
5 |
1288.46 |
1283.37 |
|
50 |
1307.79 |
1284.64 |
|
200 |
1128.83 |
1133.50 |
Inference :
-
The simple and exponential moving average displays mild bullish signal mixed with bearish signals.
-
SMA & EMA Moving Averages Crossovers indicate there are mild bullish crossovers for all the time periods.
Pivot Levels
|
Standard Pivot Levels of Narayana Hrudayalaya Limited as on 5th April, 2024 |
||||||
|
S3 |
S2 |
S1 |
Pivot |
R1 |
R2 |
R3 |
|
1242.47 |
1259.48 |
1272.87 |
1289.88 |
1303.27 |
1320.28 |
1333.67 |
CRISIL Ltd.
CRISIL Ltd., , a company which provides ratings, research and analytics all over the world. Its major division is ratings, research and advisory services. The mid cap stock company incorporated in the year 1987 with its Headquarters in Mumbai, India.
Intraday Price Analysis
|
CRISIL Ltd as on 5th April, 2024 |
|||
|
Current Price |
Open Price |
Today High |
Today Low |
|
Rs.4894.95 |
Rs.4844.95 |
Rs.4905.45 |
Rs.4820 |
Monthly Price Analysis
|
Date |
Open |
High |
Low |
Close* |
Volume |
|
|
Apr 05, 2024 |
4,844.95 |
4,905.45 |
4,820.00 |
4,894.95 |
23,348 |
|
|
Mar 31, 2024 |
5,075.95 |
5,093.25 |
4,790.00 |
4,844.95 |
3,23,212 |
|
|
Mar 28, 2024 |
28 Dividend |
|||||
|
Feb 29, 2024 |
5,059.35 |
5,268.50 |
4,764.00 |
5,068.00 |
7,33,676 |
|
|
Jan 31, 2024 |
4,090.05 |
5,250.00 |
4,031.00 |
5,017.15 |
19,15,432 |
|
|
Dec 31, 2023 |
4,329.65 |
4,336.00 |
3,660.70 |
4,095.35 |
5,57,540 |
|
|
Nov 30, 2023 |
4,292.95 |
4,425.50 |
4,103.65 |
4,336.75 |
4,88,883 |
|
|
Nov 22, 2023 |
11 Dividend |
|||||
|
Oct 31, 2023 |
4,097.05 |
4,454.95 |
3,985.00 |
4,275.25 |
11,21,718 |
|
|
Sep 30, 2023 |
3,924.15 |
4,284.30 |
3,815.00 |
4,097.05 |
14,33,498 |
|
|
Aug 31, 2023 |
3,970.95 |
3,973.00 |
3,806.80 |
3,924.15 |
5,69,516 |
|
|
Aug 02, 2023 |
8 Dividend |
|||||
|
Jul 31, 2023 |
3,936.10 |
4,075.00 |
3,716.05 |
3,970.65 |
5,61,264 |
|
|
Jun 30, 2023 |
3,911.55 |
3,984.95 |
3,772.00 |
3,915.50 |
4,28,679 |
|
|
May 31, 2023 |
3,790.95 |
4,027.60 |
3,705.65 |
3,902.95 |
6,33,042 |
|
|
May 04, 2023 |
7 Dividend |
|||||
|
Apr 30, 2023 |
3,599.20 |
3,850.00 |
3,464.05 |
3,798.70 |
624,90 |
|
The company has paid dividend four times within a period of 12 months.

On analysis of CRISIL Ltd.’s monthly price data, it is inferred that the stock displays Bullish Continuation Heikin Ashi Pattern formed indicating bullish monthly signals
Fundamental Analysis
The mid cap stock valuation displays poor performance, with the mid cap stock being overpriced. Price to Intrinsic value 3.68, Price to earnings ratio is 53.80 , EV to EBITDA is 35.95 and price to book ratio is 18.41.
The profitability of the mid cap stock is average. The Piotrowski score is 7. Over the past three years, the mid cap stock’s net profit , net margin, RoE, RoA are in uptrend. The mid cap stocks, QoQ EPS growth is outstanding. RoCE is 30.08.
The growth aspects of the mid cap stock are moderate with Total assets value in uptrend for the past three years.
The mid cap stock has exhibited excellent stability with Altman Z score of 95. The company is debt free and has good liquidity.
Technical Analysis
Indicators
As per Orca’s technical indication, the momentum of is given below
|
Type |
Value |
Momentum |
|
RSI |
50.74 |
Neutral |
|
CCI |
-76.48 |
Neutral |
|
Williams_R |
-74.04 |
Neutral |
|
UO |
41.34 |
Neutral |
|
Rate of Change |
0.72 |
Bullish |
|
MACD |
574.27 |
Bullish |
Moving Averages
|
Day |
SMA |
EMA |
|
5 |
4902.37 |
4897.15 |
|
50 |
4561.88 |
4673.84 |
|
200 |
4143.88 |
4169.78 |
Inference :
-
The simple and exponential moving average displays bullish uptrend for all the time periods.
-
SMA & EMA Moving Averages Crossovers indicate there are bullish signals for all the time periods.
Pivot Levels
|
Standard Pivot Levels of CRISIL Limited as on 5th April, 2024 |
||||||
|
S3 |
S2 |
S1 |
Pivot |
R1 |
R2 |
R3 |
|
4756.03 |
4788.02 |
4841.48 |
4873.47 |
4926.93 |
4958.92 |
5012.38 |
Conclusion
Mid cap stocks have the highest probability to become a multibagger stock since it has moderate risk with higher returns. The driving factor for this better return is the dynamic market environment and expanding market segment in which these mid cap stocks operates in. Though the large sectors also operate in expanding sectors but their capability to produce better return in short period is less comparatively to mid-cap stocks.
As of end of March 2024, the Nifty Midcap 100 has displayed a steep rise in performance to 61.21% in the Financial year 2024. The mid cap stock index has reached from 29775 points to 48027 points. The mid cap index also gained the maximum to November ,2023 to 10.37%.
Even a novice investor can utilize the better performance of the mid cap stocks in this market conditions. Open your best trading app India for beginners with Enrich Money.
Frequently Asked Questions
What benefits come with investing in mid-cap stocks?
-
Growth Potential: Mid-cap stocks often have higher growth potential compared to large-cap stocks due to their size and growth stage.
-
Less Analyst Coverage: There may be less analyst coverage for mid-cap stocks, providing opportunities for investors to discover undervalued gems.
-
Flexibility: Mid-cap stocks can offer a balance between growth potential and risk, providing diversification benefits to a portfolio.
-
Acquisition Targets: Mid-cap companies are often acquisition targets for larger companies seeking to expand, potentially leading to increased stock prices.
What are the disadvantages of investing in mid-cap stocks?
-
Volatility: Mid-cap stocks can be more volatile than large-cap stocks, making them riskier investments.
-
Liquidity: Mid-cap stocks may have lower liquidity than large-cap stocks, which can lead to wider bid-ask spreads and difficulty in buying or selling large quantities of shares.
-
Limited Resources: Mid-cap companies may have limited resources compared to large-cap companies, making them more vulnerable to economic downturns or market fluctuations.
-
Less Stability: Mid-cap stocks may lack the stability and predictability of earnings that larger, more established companies offer.
Do mid cap stocks pose a higher risk compared to large cap stocks?
Generally, mid cap stocks are considered to be riskier than large cap stocks. They can be more volatile and may be more susceptible to market fluctuations and economic downturns. However, they also have the potential for higher growth and returns.
How can investors identify good mid cap stocks to invest in?
Investors can use a variety of methods to identify good mid cap stocks, including analyzing the company's financial statements, growth potential, competitive position, and management team. It can also be helpful to consider the industry and broader economic trends.
How should investors approach investing in mid cap stocks?
Investors should approach investing in mid cap stocks with caution and do thorough research before making any investment decisions. It can be helpful to diversify your portfolio and consider your risk tolerance and investment goals.
Disclaimer: This blog is dedicated exclusively for educational purposes. Please note that the securities and investments mentioned here are provided for informative purposes only and should not be construed as recommendations. Kindly ensure thorough research prior to making any investment decisions. Participation in the securities market carries inherent risks, and it's important to carefully review all associated documents before committing to investments. Please be aware that the attainment of investment objectives is not guaranteed. It's important to note that the past performance of securities and instruments does not reliably predict future performance.