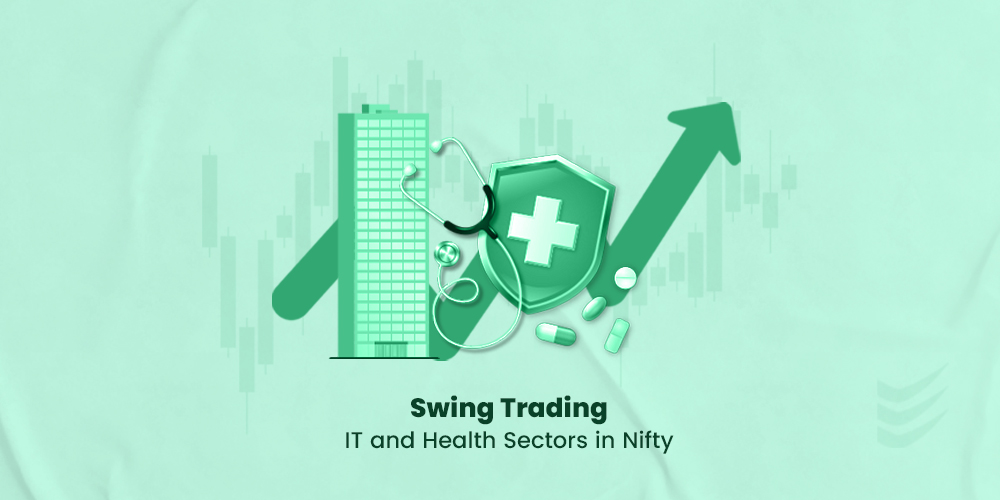
Mastering Swing Trades: Insights from IT and Health Sectors in Nifty
NIFTY IT Overview
The Nifty IT index tracks the performance of Indian IT companies, comprising 10 firms listed on the National Stock Exchange (NSE). Calculated using the free float market capitalization method, it has a base date of Jan 1, 1996, with an initial base value of 1000, later revised to 100 on May 28, 2004.
This index measures the total free float market value of all stocks relative to the base market capitalization value. It serves various purposes including benchmarking fund portfolios and facilitating the launch of index funds, ETFs, and structured products.
The sectors covered by the Nifty IT index include Computers - Software & Consulting, Computers Hardware & Equipment, Education, IT Enabled Services, and Software Products.
Constituents of Nifty IT
|
Company’s Name |
Weight(%) |
Symbol |
|
Infosys Ltd. |
27.76 |
INFY |
|
Tata Consultancy Services Ltd. |
25.20 |
TCS |
|
HCL Technologies Ltd. |
10.70 |
HCLTECH |
|
Tech Mahindra Ltd. |
8.98 |
TECHM |
|
Wipro Ltd. |
8.25 |
WIPRO |
|
LTIMindtree Ltd. |
5.49 |
LTIM |
|
Persistent Systems Ltd. |
5.02 |
PERSISTENT |
|
Coforge Ltd. |
4.51 |
COFORGE |
|
MphasiS Ltd. |
2.45 |
MPHASIS |
|
L&T Technology Services Ltd. |
1.64 |
LTTS |
Infosys Ltd.
Infosys Ltd., founded in 1981, is a leading IT Software company with a market cap of Rs 686,774.56 Crore. Its main revenue segments include Software Development Charges and Software Products. For the quarter ended December 31, 2023, Infosys reported a Consolidated Total Income of Rs 39,610.00 Crore, down 0.04% from the previous quarter and up 1.34% from the same quarter last year. Net profit after tax for the quarter stood at Rs 6,113.00 Crore.
Intraday Price/Volume Analysis of Infosys Ltd. |
|||||||
|
Infosys Ltd.as on 2 March 2024 |
Current Price |
Price Change |
Change % |
Open |
High |
Low |
Volume |
|
1662.00 |
7.30 |
0.44 |
1658.85 |
1665.00 |
1656.50 |
194224.00 |
|
Monthly Price Analysis
|
Date |
Price |
Open |
High |
Low |
Volume |
Chg% |
|
Mar-24 |
1,656.30 |
1,666.00 |
1,671.50 |
1,651.05 |
6.39M |
-1.05% |
|
Feb-24 |
1,673.90 |
1,659.55 |
1,733.00 |
1,635.50 |
101.67M |
0.83% |
|
Jan-24 |
1,660.05 |
1,535.55 |
1,689.95 |
1,487.00 |
123.70M |
7.59% |
|
Dec-23 |
1,542.90 |
1,459.90 |
1,593.00 |
1,433.15 |
130.08M |
6.03% |
|
Nov-23 |
1,455.15 |
1,373.05 |
1,467.90 |
1,351.65 |
85.76M |
6.34% |
|
Oct-23 |
1,368.40 |
1,436.05 |
1,518.25 |
1,353.10 |
115.66M |
-4.67% |
|
Sep-23 |
1,435.45 |
1,430.95 |
1,518.40 |
1,416.00 |
101.54M |
0.00% |
|
Aug-23 |
1,435.45 |
1,362.00 |
1,444.90 |
1,348.45 |
107.16M |
5.88% |
|
Jul-23 |
1,355.70 |
1,330.00 |
1,498.80 |
1,305.00 |
212.49M |
1.51% |
|
Jun-23 |
1,335.50 |
1,322.55 |
1,338.90 |
1,262.25 |
125.30M |
1.30% |
|
May-23 |
1,318.30 |
1,254.55 |
1,332.70 |
1,239.05 |
153.76M |
5.23% |
|
Apr-23 |
1,252.75 |
1,435.00 |
1,435.00 |
1,185.30 |
181.90M |
-12.27% |
|
Mar-23 |
1,427.95 |
1,492.40 |
1,520.40 |
1,364.55 |
142.67M |
-4.01% |
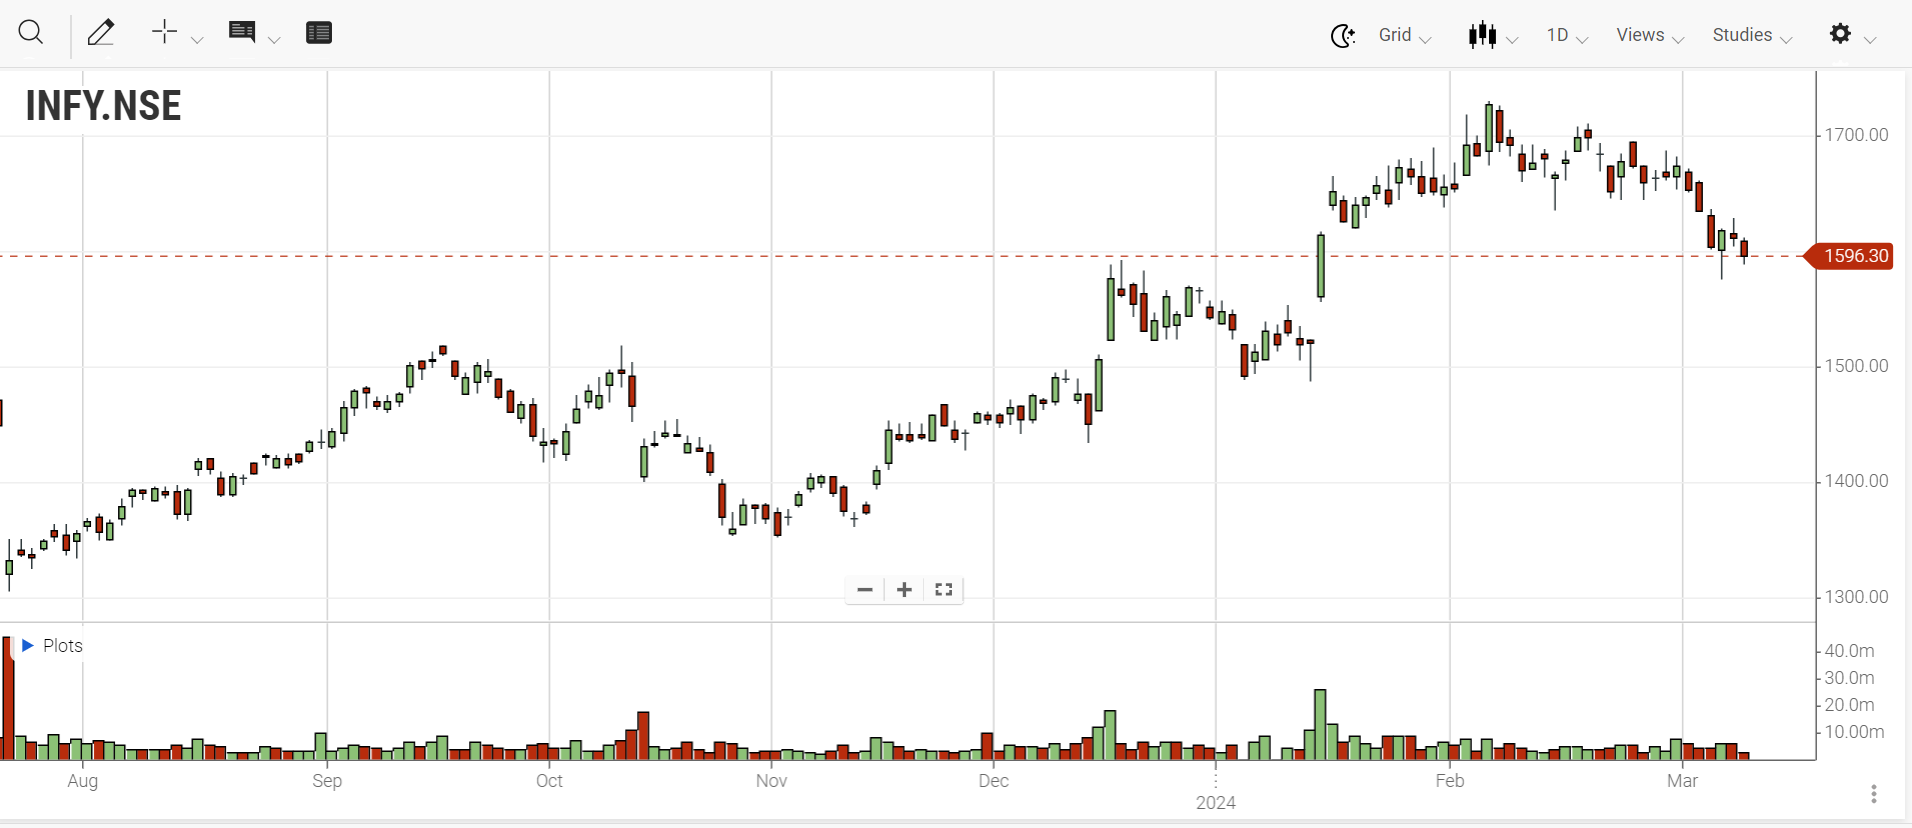
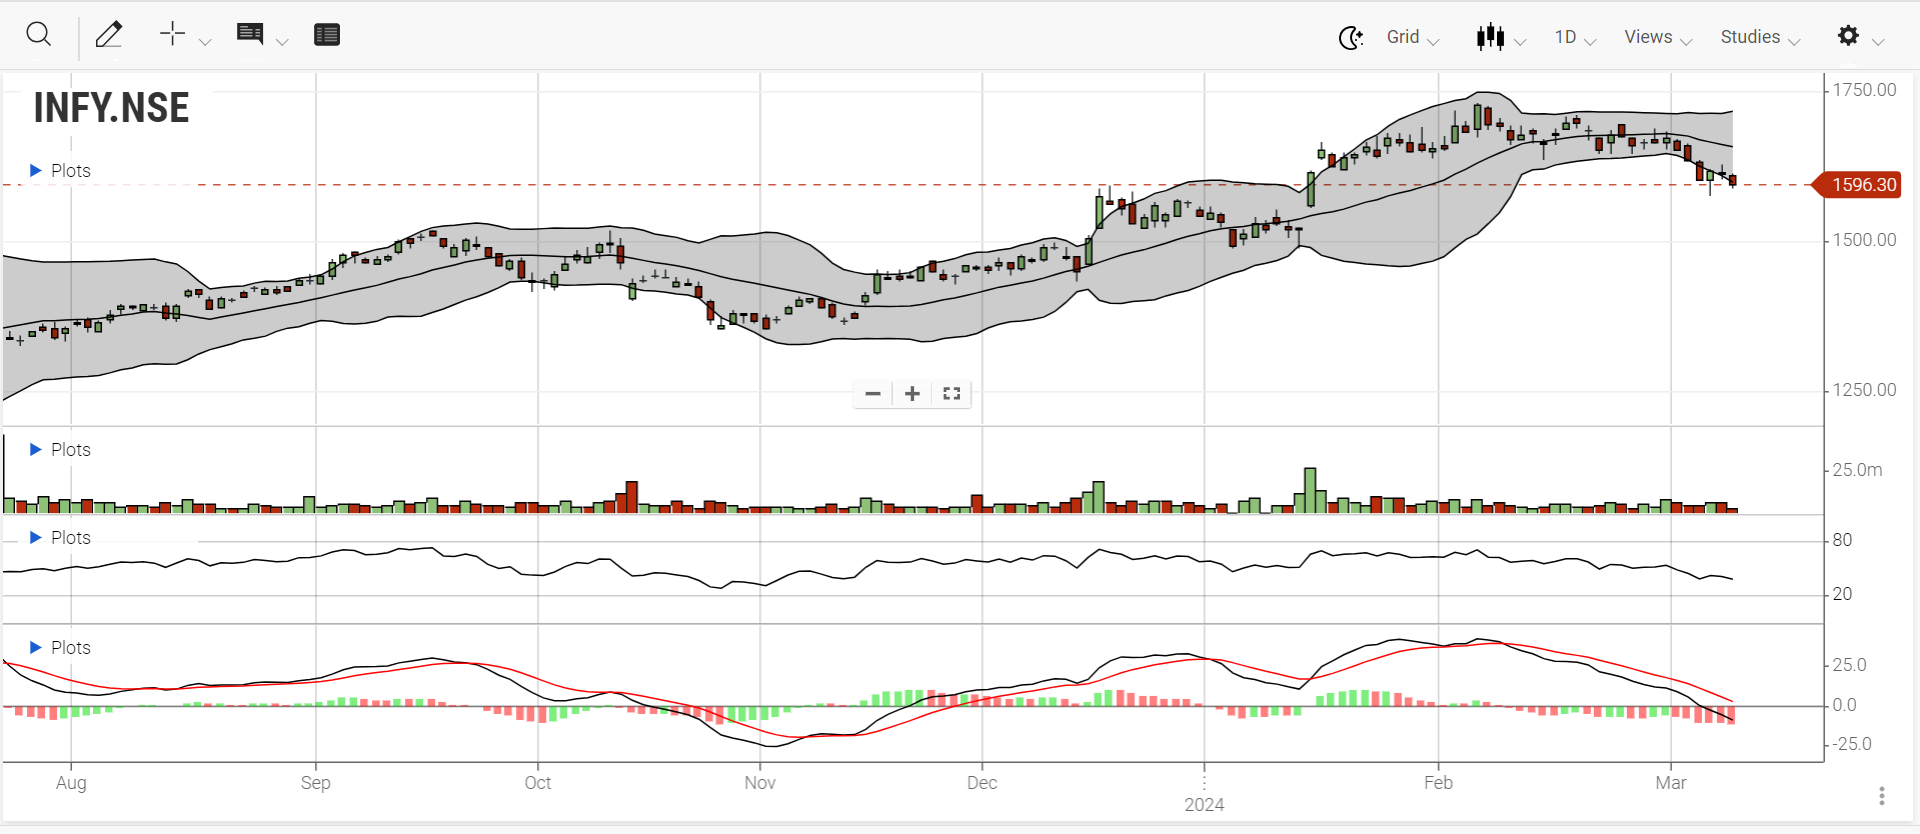
In the monthly analysis of Infosys Ltd, a green candlestick signals a bullish trend, indicating the formation of a Bullish Continuation Heikin Ashi Pattern.
Fundamental Analysis
Valuation Analysis:
-
TSR Value Index ranges from low to high at 15.63%, which is notably poor.
-
Book value has shown a positive trend over the past 3 years.
-
The price Book Ratio is high, standing at 11.41, indicating an expensive stock.
-
Key ratios show a decrease year over year: P/E by 31.75%, P/B by 25.69%, and P/S by 38.36%.
-
Enterprise Value to EBITDA Multiple has decreased significantly by 33.58%.
-
Caution may be warranted regarding the stock's current pricing and performance.
Profitability Analysis:
-
Over the last 3 years, the company has demonstrated incredible Return on Equity.
-
A strong Return on Capital Employed is recorded at 31.97%.
-
The company is earning excess returns, with Annual Net Profit trending up over the last 3 years.
-
In the past twelve months, the company achieved a robust Return on Equity of 40.63% and a Return on Assets of 23.71%.
-
Piotroski F Score remains stable at 5.0.
-
EBITDA has shown continuous growth over the past 3 years.
-
The company has achieved a good Net Margin of 15.92%.
-
However, the Earning Yield remains low at 3.56%.
Growth Analysis:
-
TSR Growth Index ranges from low to high at 26.72%, with a relatively poor score.
-
Total sales have shown a tremendous increasing trend over the last 3 years.
-
Total assets have steadily increased over the past 3 years.
-
Revenue has grown by 20.66% year over year and slightly quarter over quarter.
-
EBITDA has increased by 11.97% year over year and 1.49% quarter over quarter.
-
Net Profit has grown by 8.98% year over year and 1.71% quarter over quarter.
-
EPS has increased by 9.73% year over year.
Stability Analysis :
-
The Tsr Stability Index shows an excellent score of 87.50.
-
An Altman Z Score of 10.57 indicates good stability for the company.
-
The company is debt-free.
Technical Analysis
Enrich Money's Orca app offers enhanced insights into stock momentum through its technical and fundamental analysis.
According to Orca's technical indicators, here is the momentum analysis for Infosys Limited.
|
Type |
Value |
Momentum |
|
RSI |
48.45 |
Neutral |
|
CCI |
-89.65 |
Neutral |
|
Williams_R |
-82.27 |
Bullish |
|
UO |
45.72 |
Neutral |
|
Rate of Change |
-2.67 |
Bearish |
|
MACD |
-1759.36 |
Bearish |
|
Moving Averages |
||
|
Day |
EMA |
SMA |
|
5 |
1,662.60 |
1,663.95 |
|
50 |
1,628.20 |
1,630.39 |
|
200 |
1,513.45 |
1,456.23 |
Inference
-
Short-term moving averages (EMA and SMA) are higher than long-term ones, indicating recent upward momentum.
-
More bullish moving averages than bearish ones suggest prevailing bullish sentiment.
-
Overall, the stock is showing a short to medium-term bullish trend based on moving average analysis.
|
Daily Pivot Levels of Infosys Ltd.as on 2nd Mar 24 |
|||||||
|
Type |
S3 |
S2 |
S1 |
Pivot |
R1 |
R2 |
R3 |
|
Standard |
1640.95 |
1647.5 |
1651.9 |
1658.45 |
1662.85 |
1669.4 |
1673.8 |
Based on the Daily Pivot Levels of Infosys Ltd., here is an analysis for swing trading:
-
Buy Entry
-
The swing trader may consider buying the stock if the price reaches or dips slightly below the Support 1 (S1) level, which is at 1651.90.
-
Sell Exit
-
The swing trader may consider selling the stock when the price reaches or approaches the Resistance 1 (R1) level, which is at 1662.85.
-
Risk and Reward
-
For risk management, the swing trader can set a stop-loss order slightly below the Support 2 (S2) level, which is at 1647.50.
-
This stop-loss level helps limit potential losses if the trade goes against the trader's expectations.
-
As for reward, the swing trader can aim for a target price near the Resistance 2 (R2) level, which is at 1669.40.
-
This target price provides a potential profit opportunity as the price may encounter resistance near this level.
In short,consider buying near the Support 1 (S1) level at 1651.90, selling near the Resistance 1 (R1) level at 1662.85, setting a stop-loss below the Support 2 (S2) level at 1647.50, and aiming for a target price near the Resistance 2 (R2) level at 1669.40.
Nifty Healthcare
Nifty Health Overview
The Nifty Healthcare Index is designed to reflect the behavior and performance of healthcare companies. It consists of a maximum of 20 exchange-listed companies that are tradable. Computed using the free float market capitalization method, the index level reflects the total free float market value of all the stocks relative to a particular base market capitalization value. The Nifty Healthcare Index serves multiple functions, such as benchmarking fund portfolios and aiding in the introduction of index funds, ETFs, and structured products.
Constituents of Nifty HealthCare
|
Company’s Name |
Weight(%) |
|
Sun Pharmaceutical Industries Ltd. |
23.09 |
|
Dr. Reddy's Laboratories Ltd. |
10.6 |
|
Cipla Ltd. |
10.53 |
|
Apollo Hospitals Enterprise Ltd. |
8.32 |
|
Max Healthcare Institute Ltd. |
7.94 |
|
Divi's Laboratories Ltd. |
6.03 |
|
Lupin Ltd. |
5.3 |
|
Aurobindo Pharma Ltd. |
3.92 |
|
Alkem Laboratories Ltd. |
3.49 |
|
Torrent Pharmaceuticals Ltd. |
3.3 |
Sun Pharmaceutical Industries Ltd.
Intraday Price Analysis of Sun Pharmaceutical Industries Ltd.
|
Code |
Price |
Previous Price |
Price Change |
Latest Volume |
5 Period Avg Volume |
|
SUNPHARMA |
1552 |
1559.25 |
0.47% |
95308 |
1846K |
Monthly Price Analysis
|
Date |
Price |
Open |
High |
Low |
Volume |
Chg% |
|
Mar-24 |
1,550.55 |
1,581.75 |
1,581.75 |
1,540.35 |
4.07M |
-1.74% |
|
Feb-24 |
1,577.95 |
1,427.00 |
1,587.80 |
1,398.90 |
51.28M |
11.52% |
|
Jan-24 |
1,415.00 |
1,262.10 |
1,438.75 |
1,252.70 |
28.52M |
12.35% |
|
Dec-23 |
1,259.45 |
1,233.05 |
1,271.95 |
1,208.55 |
39.18M |
2.74% |
|
Nov-23 |
1,225.85 |
1,092.00 |
1,231.15 |
1,082.60 |
36.59M |
12.61% |
|
Oct-23 |
1,088.60 |
1,159.55 |
1,161.95 |
1,068.35 |
34.32M |
-6.05% |
|
Sep-23 |
1,158.65 |
1,112.00 |
1,167.40 |
1,102.00 |
42.06M |
4.23% |
|
Aug-23 |
1,111.60 |
1,143.40 |
1,169.70 |
1,100.25 |
51.15M |
-2.78% |
|
Jul-23 |
1,143.40 |
1,053.00 |
1,155.35 |
1,028.75 |
53.68M |
8.73% |
|
Jun-23 |
1,051.60 |
979.8 |
1,055.00 |
975 |
58.61M |
7.82% |
|
May-23 |
975.35 |
987.65 |
988.9 |
922.45 |
62.72M |
-1.25% |
|
Apr-23 |
987.65 |
981 |
1,023.85 |
959.25 |
33.81M |
0.46% |
|
Mar-23 |
983.1 |
951 |
996.5 |
946.1 |
44.63M |
2.77% |
Fundamental Analysis
Valuation Analysis:
-
The TSR Value Index ranges from low to high at 29.17%.
-
Book Value has shown an upward trend over the last 3 years.
-
The TSR Value Index indicates a poor score of 29.17.
-
The Price Book Ratio stands at 6.42, suggesting it is relatively expensive.
Profitability Analysis:
The company's profitability analysis shows promising signs, with the TSR Profit Index at 63.13%. It demonstrates earning excess return, with key margins growing by 15% and a stable Piotroski F Score of 5.0. Over the last three years, there's been consistent growth in annual net profit, and the company has seen increases in net profit and profit before tax over the last five quarters. EBITDA has continuously risen over three years, and EPS shows steady growth over four quarters. With good returns on capital employed and equity, along with a solid net margin, the company exhibits strong financial performance. However, the low dividend yield and earning yield suggest room for improvement in shareholder returns.
Growth Analysis:
TSR Growth Index ranging from low to high at 40.38%, the company exhibits a short-term positive trend in total sales and net profit, accompanied by a significant year-over-year net margin increase of 130.40%. Annual sales have consistently increased for three consecutive years, and quarterly sales over the last 5 years show an upward trend. Additionally, there's been a steady increase in total assets over the past 3 years. However, operating cash flow has been decreasing over the same period.
Stability Analysis:
TSR Stability Index ranges from low to high at 79.69%, indicating a good score. Furthermore, the Altman Z Score of 11.13 suggests a stable financial position for the company.
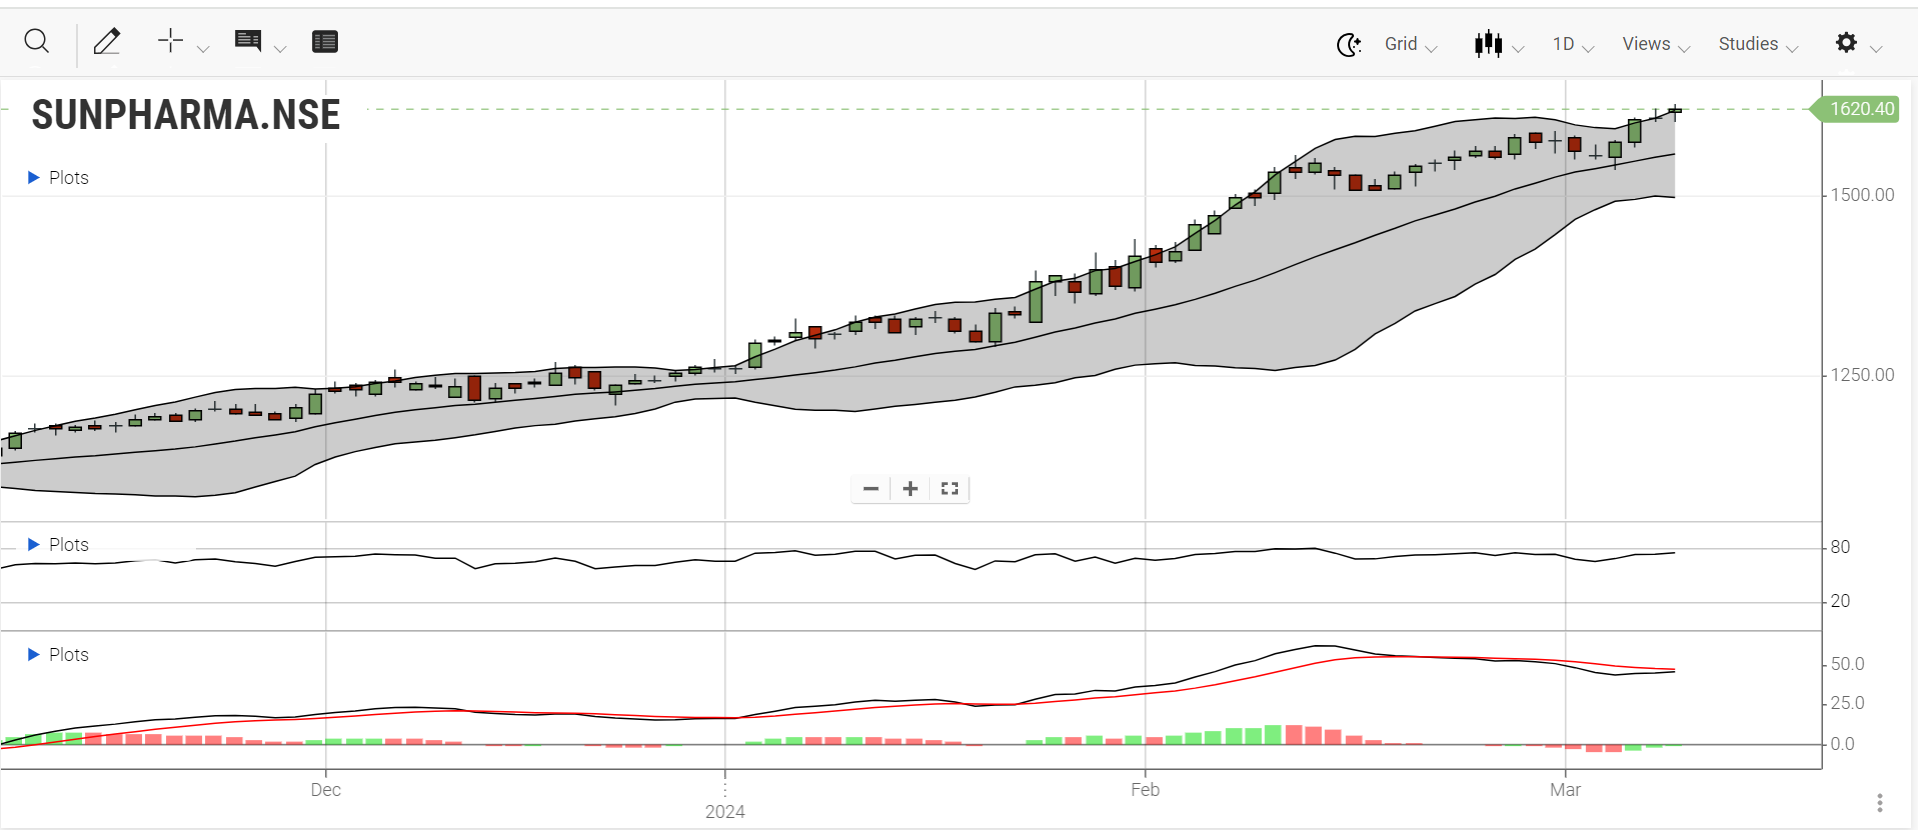
Technical Analysis
Enrich Money's Orca app offers enhanced insights into stock momentum through its technical and fundamental analysis.
According to Orca's technical indicators, here is the momentum analysis for Sun Pharmaceutical Industries Ltd.
|
Type |
Value |
Momentum |
|
RSI |
64.57 |
Neutral |
|
CCI |
29.81 |
Neutral |
|
Williams_R |
-44.91 |
Neutral |
|
UO |
59.88 |
Neutral |
|
Rate of Change |
2.69 |
Bullish |
|
MACD |
-1880.27 |
Bearish |
|
Moving Averages |
||
|
Day |
EMA |
SMA |
|
5 |
1,557.50 |
1,562.43 |
|
50 |
1,438.68 |
1,418.79 |
|
200 |
1,231.39 |
1,186.23 |
Inference: A Monthly Bullish Continuation Heikin Ashi Pattern has formed.
|
Daily Pivot Levels of Sun Pharmaceutical Industries Ltd.as on 3rd Mar 24 |
|||||||
|
Type |
S3 |
S2 |
S1 |
Pivot |
R1 |
R2 |
R3 |
|
Standard |
1480.37 |
1502.18 |
1526.37 |
1548.18 |
1572.37 |
1594.18 |
1618.37 |
Based on the Daily Pivot Levels of Sun Pharmaceutical Industries Ltd. as of March 3rd, 2024, here is an analysis for swing trading:
-
Buy Entry
Swing traders may consider buying the stock if the price reaches or dips slightly below the Support 1 (S1) level, which is at 1526.37.
-
Sell Exit
Swing traders may consider selling the stock when the price reaches or approaches the Resistance 1 (R1) level, which is at 1572.37.
-
Risk and Reward
For risk management, swing traders can set a stop-loss order slightly below the Support 2 (S2) level, which is at 1502.18. This stop-loss level helps limit potential losses if the trade goes against the trader's expectations.
As for the reward, swing traders can aim for a target price near the Resistance 2 (R2) level, which is at 1594.18. This target price provides a potential profit opportunity as the price may encounter resistance near this level.
In summary, consider buying near the Support 1 (S1) level at 1526.37, selling near the Resistance 1 (R1) level at 1572.37, setting a stop-loss below the Support 2 (S2) level at 1502.18, and aiming for a target price near the Resistance 2 (R2) level at 1594.18.
Conclusion
In conclusion, mastering swing trades involves a comprehensive understanding of various factors affecting stock performance, as demonstrated by the insights gleaned from the IT and healthcare sectors in Nifty.
Applying swing trading strategies to both Infosys Ltd. and Sun Pharmaceutical Industries Ltd. based on their respective daily pivot levels offers actionable insights for potential buy and sell points, risk management, and profit targets.
For swing trading for beginners, utilizing the best trading app in India can provide a user-friendly platform for executing trades. Creating a swing trade stocks list can help traders identify potential opportunities, and studying examples of swing trading can offer valuable insights into effective strategies. Overall, mastering swing trades requires a holistic approach integrating fundamental and technical analyses to navigate the dynamic stock market landscape effectively.
Frequently Asked Questions
-
How do I select swing trading stocks for next week?
Look for stocks with strong technical setups, such as price patterns or trend reversals, supported by fundamental analysis. Consider stocks with upcoming catalysts like earnings releases or product launches.
-
What are some common swing trading strategies?
Common swing trading strategies include trend following, breakouts, pullbacks, and reversal patterns. These strategies rely on technical analysis tools such as moving averages, support and resistance levels, and momentum oscillators.
-
How can beginners start swing trading?
swing trading for beginners can be done by learning technical analysis, risk management, and creating a trading plan. Start with small capital, practice on a demo account, and use best trading app india for beginners
-
Can you provide an example of swing trading?
An example of swing trading could involve buying a stock that has recently bounced off a support level and shows signs of upward momentum. The trader enters the trade with a target price set near the next resistance level and a stop-loss order placed just below the support level.
-
What is a swing trade stocks list?
A swing trade stocks list is a compilation of stocks that traders identify as potential candidates for swing trading based on technical and fundamental analysis criteria.
Related Stocks:
Sun Pharmaceutical Industries Ltd.
Disclaimer: This blog is dedicated exclusively for educational purposes. Please note that the securities and investments mentioned here are provided for informative purposes only and should not be construed as recommendations. Kindly ensure thorough research prior to making any investment decisions. Participation in the securities market carries inherent risks, and it's important to carefully review all associated documents before committing to investments. Please be aware that the attainment of investment objectives is not guaranteed. It's important to note that the past performance of securities and instruments does not reliably predict future performance.