Strategic Analysis of Three Nifty Financial Services Ex-Bank Stocks

Indian Financial Services Ex- Bank Industry
India has experienced enormous growth, catering to under developed segments of the economy. Despite a 2.1% annual decline in the number of financial services ex- bank institutions, their asset size grew by 18.76% annually until 2017-2018. From 2005-2006 to 2016-2017, asset growth was 19.6% annually, decreasing to 14.3% from 2017-2018 to 2019-2020. Analysis shows the decline in financial services ex- bank’s institutions, adversely impacts asset growth, especially due to regulatory tightening post-2017. Market borrowings to bank borrowings ratio had an insignificant positive impact due to RBI's policy to reduce market dependence. Financial services ex- bank’s institutions focus on high-risk segments. Prudential norms should be targeted rather than blanket to avoid hampering growth. A risk-based approach is necessary, requiring proper identification of systemically important financial services ex- bank’s institutions and appropriate regulations to sustain growth and manage systemic risk effectively.
Nifty Financial Services Ex-Bank Stocks
Nifty Financial Services Ex-Bank index helps to monitor the stocks performance of the financial services offered by institutions other than banks . Stocks from qualified institutions are considered for the index based on free float market capitalization method on an average of six months. It comprises 30 stocks that are listed and traded in stock exchanges with a base value of 1000. The Nifty Financial Services Ex- Bank index serves as a benchmark , index funds creation, Equity Traded Funds and various structured products. The Nifty Financial Services Ex- Bank index was started on 1st April, 2005. This index is rebalanced on a semi-annual basis.
|
Company Name |
Weightage |
|
Bajaj Finance Ltd. |
15.54% |
|
Jio Financial Services Ltd. |
9.29% |
|
Bajaj Finserv Ltd. |
6.91% |
|
Power Finance Corporation Ltd. |
5.95% |
|
REC Ltd. |
5.54% |
|
Shriram Finance Ltd. |
5.45% |
|
SBI Life Insurance Company Ltd. |
5.20% |
|
HDFC Life Insurance Company Ltd. |
4.83% |
|
Cholamandalam Investment and Finance Company Ltd. |
4.25% |
|
ICICI Lombard General Insurance Company Ltd. |
3.37% |
|
Aditya Birla Capital Ltd. |
|
|
BSE Ltd. |
|
|
Bajaj Holdings & Investment Ltd. |
|
|
Can Fin Homes Ltd. |
|
|
HDFC Asset Management Company Ltd. |
|
|
ICICI Prudential Life Insurance Company Ltd. |
|
|
IDFC Ltd. |
|
|
Indian Energy Exchange Ltd. |
|
|
L&T Finance Ltd. |
|
|
LIC Housing Finance Ltd. |
|
|
Mahindra & Mahindra Financial Services Ltd. |
|
|
Manappuram Finance Ltd. |
|
|
Max Financial Services Ltd. |
|
|
Multi Commodity Exchange of India Ltd. |
|
|
Muthoot Finance Ltd. |
|
|
One 97 Communications Ltd. |
|
|
PB Fintech Ltd. |
|
|
Piramal Enterprises Ltd. |
|
|
SBI Cards and Payment Services Ltd. |
|
|
Sundaram Finance Ltd. |
|
Performance Comparison of all Sector Indices for a period of 1 year in NSE
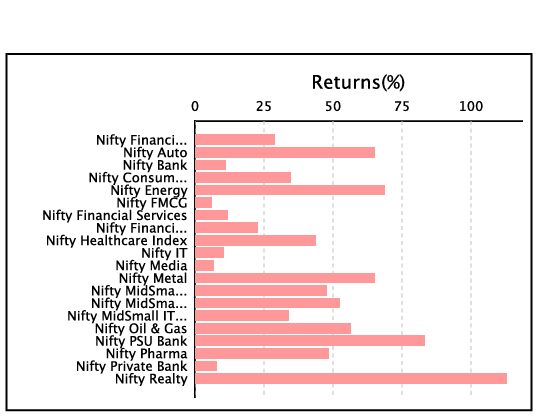
Source : niftyindices.com
Nifty financial services ex- bank stocks have delivered a total return of 29.89% for a period of 1 year. The price return for a period of 1 year is 28.95%. The total price return on quarter to date was – 0.13% and year to date was 3.17%
Historical Price Analysis of Nifty Financial Services Ex- Bank

The price to equity ratio is 21.6 and price to book ratio is 3.25. The Nifty financial services ex- bank index has delivered a dividend yield of 0.86%.
Eligibility Criteria for Nifty Financial Services Ex- Bank Constituent Stock
-
The stock considered for Nifty Financial Services Ex- Bank constituents should be part of Nifty 500 at review time.
-
Final selection of 30 companies will be based on the free-float market capitalization method.
-
Reconstitution of the index happens semi-annually together with Nifty Broad-based indices.
-
Stocks in the Financial Services sector excluding banks are considered for inclusion during the review under Nifty Financial Services Ex- Bank.
Nifty Financial Services Ex- Bank’s Stock Comparison
To analyze the Nifty financial services ex- bank’s stocks, let’s consider three of the Nifty financial services ex- bank’s stocks for comparative analysis.
Welcome to Enrich Money's digital investing platform. Open a free demat trading account with Enrich Money, a leading wealth tech management company.
Let’s consider the below stocks for comparative analysis.
Intraday Price Comparative Analysis
|
Stock Name (as of 18th June, 2024) |
Bajaj Finance Ltd. |
Bajaj Finserv Ltd. |
Power Finance Corporation Ltd. |
|
Open (INR) |
Rs.7365 |
Rs.1599 |
Rs.512.50 |
|
High (INR) |
Rs.7429.45 |
Rs.1604.90 |
Rs.512.60 |
|
Low (INR) |
Rs.7301 |
Rs.1585 |
Rs.504.50 |
|
Last Traded Price (INR) |
Rs.7340 |
Rs.1595.85 |
Rs.509.35 |
|
Price Change (%) |
-1.21% |
-0.58% |
-0.66% |
|
Volume |
791330 |
968740 |
9744337 |
|
Previous Close (INR) |
Rs.7341.55 |
Rs.1591.75 |
Rs.510.05 |
Monthly Price Comparative Analysis
|
Stock Name |
Bajaj Finance Ltd. |
Bajaj Finserv Ltd. |
Power Finance Corporation Ltd. |
|
Date |
Closing Price in INR |
||
|
Jun 18, 2024 |
7,347.30 |
1,595.95 |
509.1 |
|
Jun 1, 2024 |
7,341.55 |
1,591.75 |
510.05 |
|
May 1, 2024 |
6,697.70 |
1,528.60 |
492.45 |
|
Apr 1, 2024 |
6,923.55 |
1,615.00 |
441.55 |
|
Mar 1, 2024 |
7,245.25 |
1,643.85 |
390.25 |
|
Feb 1, 2024 |
6,495.35 |
1,593.80 |
400.7 |
|
Jan 1, 2024 |
6,862.90 |
1,627.30 |
443.25 |
|
Dec 1, 2023 |
7,327.75 |
1,685.80 |
382.6 |
|
Nov 1, 2023 |
7,121.90 |
1,673.50 |
334.9 |
|
Oct 1, 2023 |
7,492.65 |
1,569.55 |
246.6 |
|
Sep 1, 2023 |
7,810.75 |
1,540.25 |
251.9 |
|
Aug 1, 2023 |
7,163.00 |
1,488.90 |
208.16 |
|
Jul 1, 2023 |
7,300.30 |
1,598.30 |
209.12 |
While observing the monthly stock price data, the stock price of Bajaj Finserv stocks is in downtrend.
Chart Analysis
Bajaj Finance Ltd.
Bajaj Finance Limited offers a wide range of financial products and services, including consumer finance, SME loans, and commercial lending. Bajaj Finance has a robust presence across India, with a large customer base. It is considered a leader in the NBFC sector, known for its strong financial performance and market reputation.
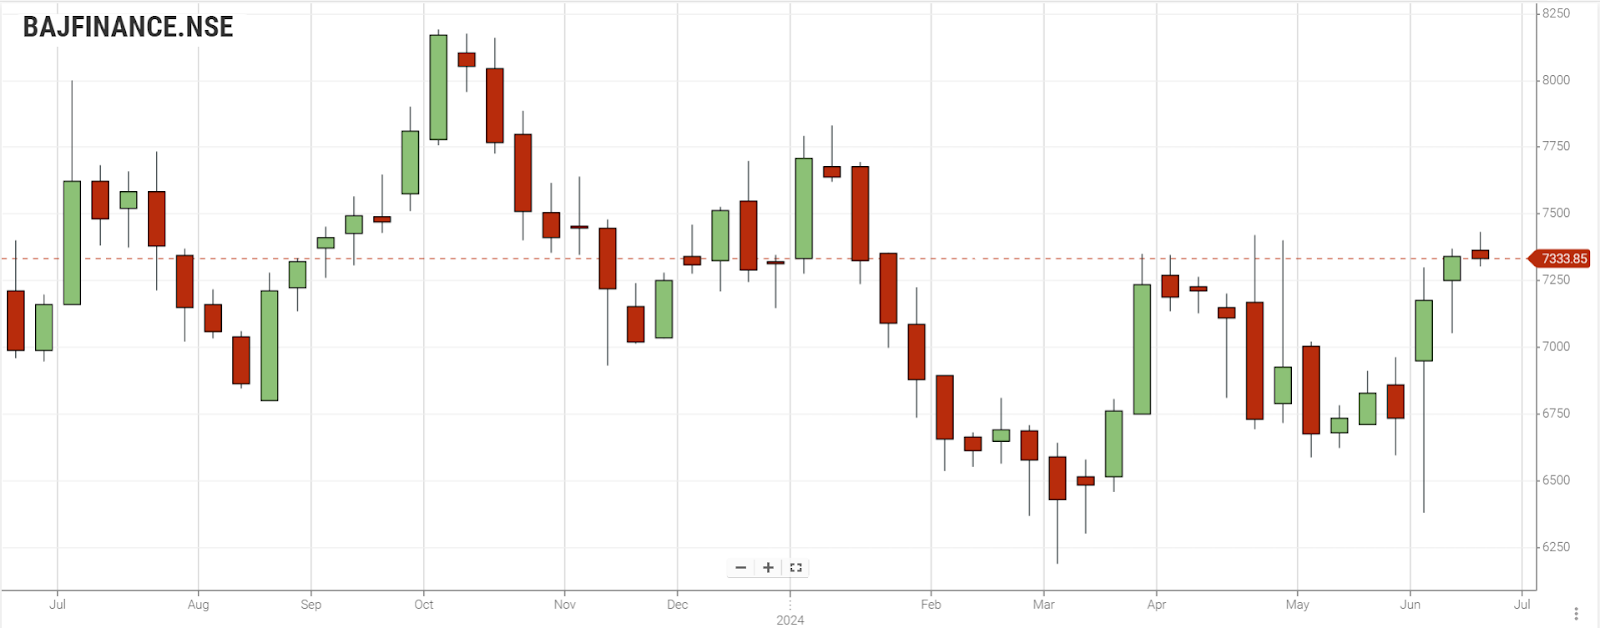
The Bullish Continuation Heikin Ashi pattern is formed on daily charts. The Bullish Initiation Heikin Ashi pattern is formed on weekly charts. Bullish Heikin Ashi pattern with tick from red to green is observed on monthly price data.
Bajaj Finserv Ltd.
Bajaj Finserv Limited , under the Bajaj group. Offers services like insurance, lending, and wealth advisory. The company has a strong presence in India and is recognized for its financial stability and growth. Bajaj Finserv is listed on the stock exchanges and is a part of the Bajaj group, a well-established conglomerate in India.
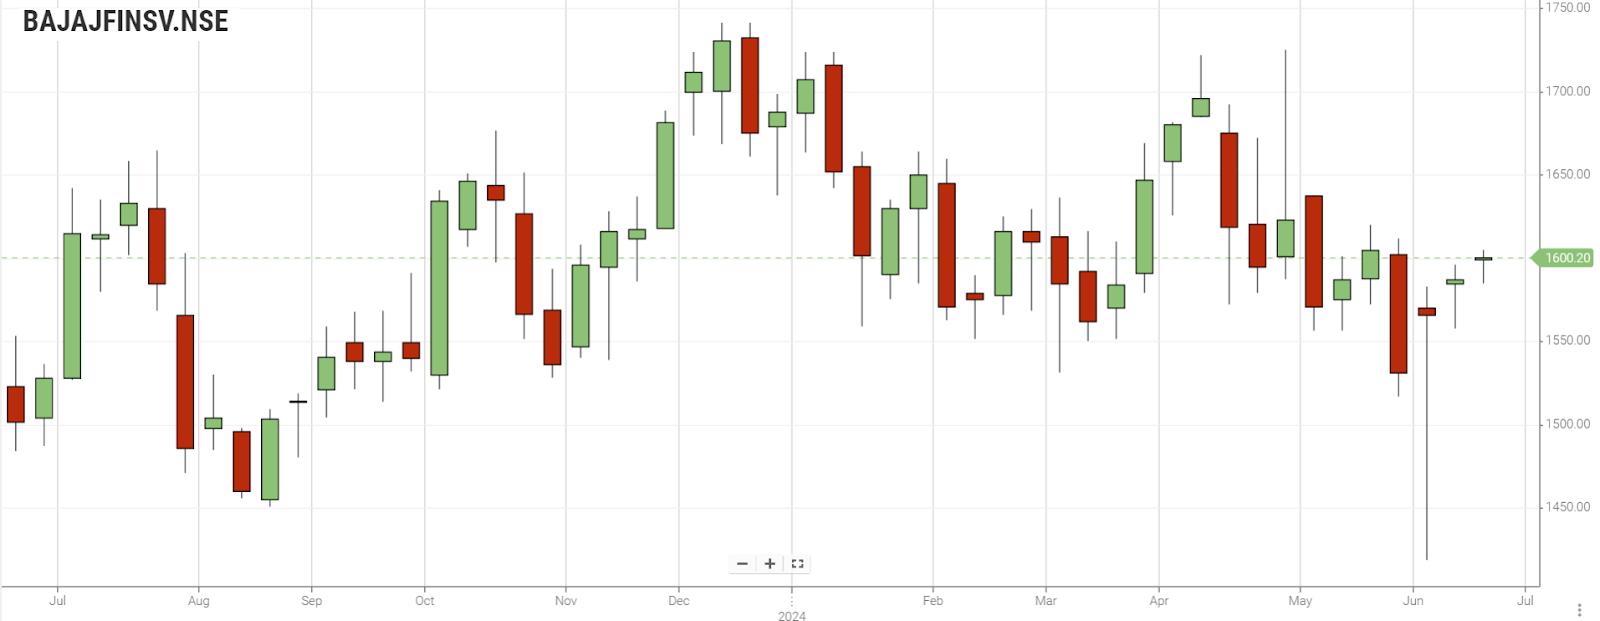
The Bullish Continuation Heikin Ashi pattern is formed on daily charts. The Bullish Initiation Heikin Ashi pattern is formed on weekly charts. Bearish Initiation Heikin Ashi pattern is observed on monthly price data.
Power Finance Corporation Ltd.
Power Finance Corporation Ltd. (PFC) primarily finances power sector projects and provides financial assistance to power utilities.The development of the power infrastructure in India is driven by PFC The company is known for its competitive interest rates and flexible financing options. PFC is a key player in India's power sector and contributes significantly to the country's energy development.
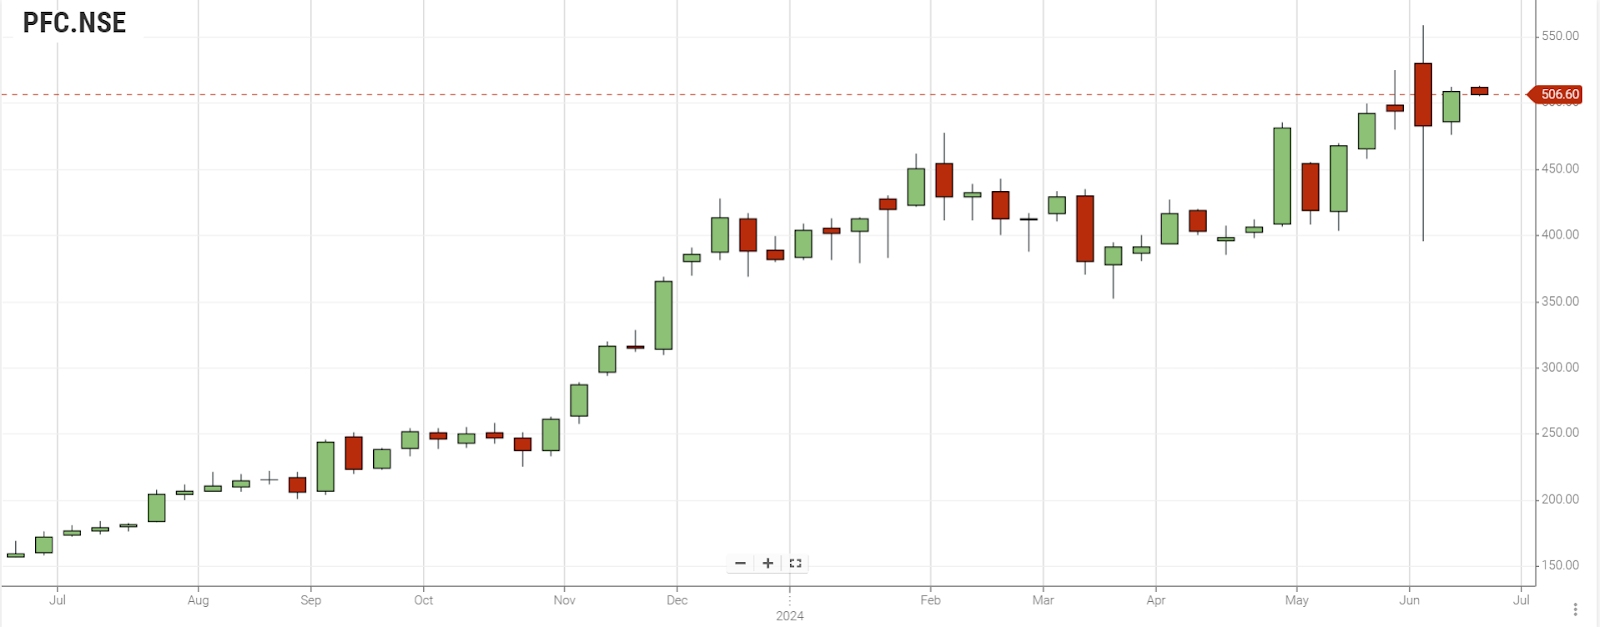
The Bullish Continuation Heikin Ashi pattern is formed on daily charts. The Consolidation Heikin Ashi pattern with a spinning top is formed on weekly charts. Bullish Continuation Heikin Ashi pattern with high volume is observed on monthly price data.
Fundamental Analysis
|
Stock Name |
Bajaj Finance Ltd. |
Bajaj Finserv Ltd. |
Power Finance Corporation Ltd. |
|
Market Cap (in INR Crores) |
455104.16 |
254252.47 |
168239.18 |
|
Dividend Yield % |
0.49% |
0.06% |
2.65% |
|
TTM EPS (in INR Crores) |
233.09 |
51.03 |
59.88 |
|
TTM PE |
31.49 |
31.21 |
8.51 |
|
P/B |
5.92 |
4.21 |
1.66 |
|
ROE |
18.84% |
13.51% |
19.54% |
Bajaj Finance Ltd.
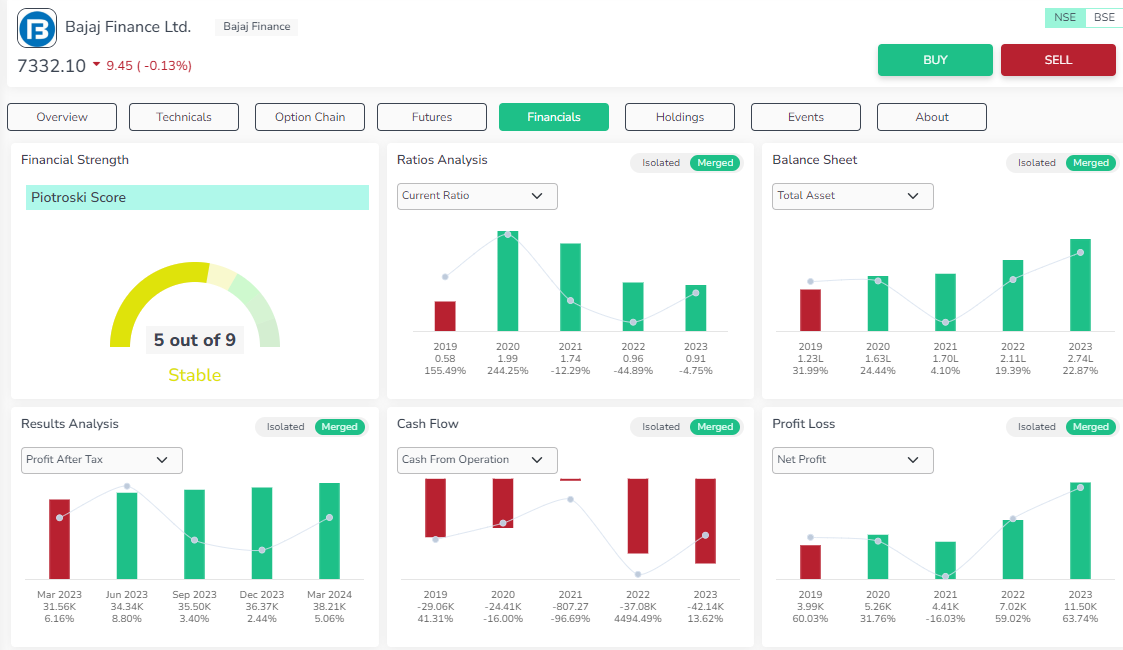
Valuation - The stock is over expensive .
Profitability -The stock has an excellent piotroski score , with steady EPS growth . The company’s return on profitability is in uptrend. The company’s dividend and earnings yield are very low.
Growth - The company’s growth in the last three years has shown steady increase but the operating cash flow has decreased in the last three years.
Stability - The stock has excellent stability. Company’s liquidity has to be improved.
Bajaj Finserv Ltd.
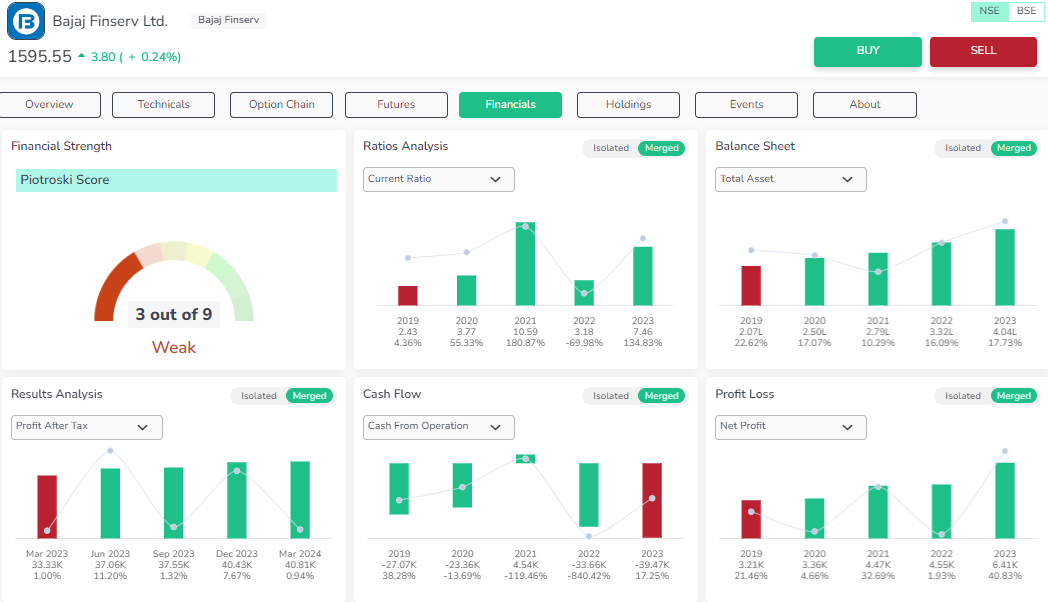
Valuation - The stock is over expensive .Book value of the share is decreasing in the last three years.
Profitability - Steady EPS growth . The company’s return on profitability is in uptrend in the last five quarters. The company’s dividend and earnings yield are very low.
Growth - The company’s growth in the last three years has shown steady increase but the operating cash flow has decreased in the last three years.
Stability - The stock has very poor stability. Company’s liquidity has to be improved.
Power Finance Corporation Ltd.
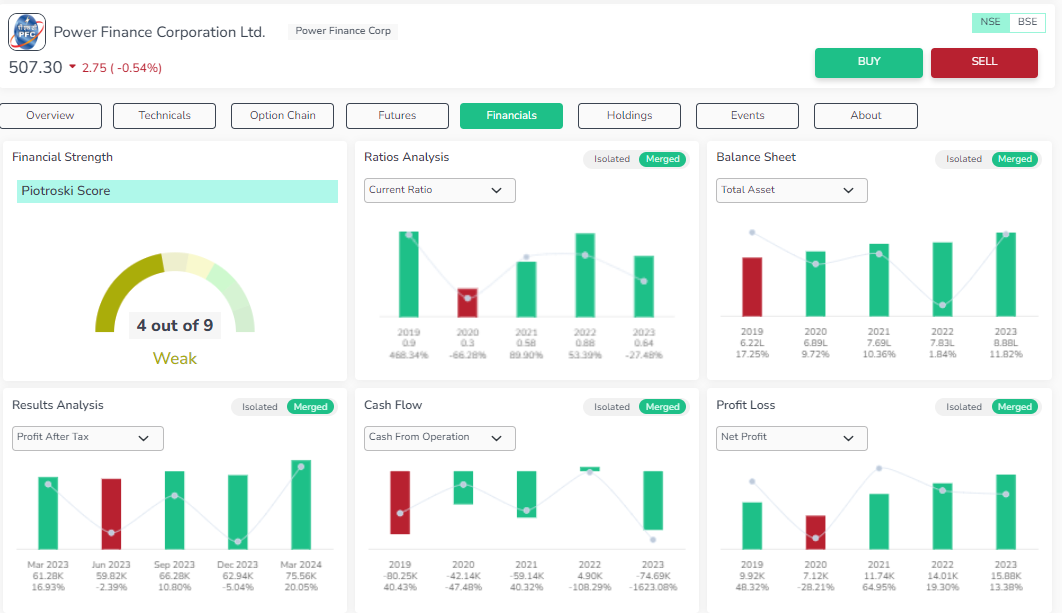
Valuation - The stock is underpriced
Profitability - Steady EPS growth . The company’s return on profitability is in uptrend in the last five quarters. The company’s dividend and earnings yield are good. But the return on assets is very low in the last three years.
Growth - The company’s growth in the last three years has shown steady increase but the operating cash flow has decreased in the last three years.
Stability - The stock has good stability and debt free. Company’s liquidity has to be improved.
Technical Analysis
For a detailed analysis of stocks' technical and fundamental aspects, access the Orca app
|
Technical Analysis @ 18.06.2024 |
|||
|
Stock Name |
Bajaj Finance Ltd. |
Bajaj Finserv Ltd. |
Power Finance Corporation Ltd. |
|
Moving Averages |
|||
|
SMA 20 Days |
6906.78 |
1607.25 |
426.44 |
|
EMA 20 Days |
6843.78 |
1602.6 |
423.64 |
|
SMA 200 Days |
7196.44 |
1600.8 |
334.43 |
|
EMA 200 Days |
6950.29 |
1578.11 |
334.72 |
|
Indicators |
|||
|
RSI |
41.86 |
39.22 |
55.72 |
|
CCI |
-85.23 |
-104.36 |
85.5 |
|
WILLIAMS_R |
-53.7 |
-79.1 |
-6.35 |
|
UO |
40.19 |
37.21 |
69.32 |
|
Rate of Change |
-3.1 |
-2.92 |
-5.59 |
|
MACD |
-79.8 |
-14.61 |
11.42 |
|
ADX |
0 |
0 |
0 |
|
Standard Pivot Levels |
|||
|
R4 |
6708.8 |
1581.35 |
463.25 |
|
R3 |
6701.2 |
1578.23 |
460.83 |
|
R2 |
6693.6 |
1575.12 |
458.42 |
|
R1 |
6687.3 |
1572.93 |
456.68 |
|
Pivot |
6679.7 |
1569.82 |
454.27 |
|
S1 |
6673.4 |
1567.63 |
452.53 |
|
S2 |
-6678.4 |
-1568.88 |
-453.58 |
|
S3 |
6659.5 |
1562.33 |
448.38 |
|
S4 |
6653.2 |
1560.15 |
446.65 |
Bajaj Finance Ltd.
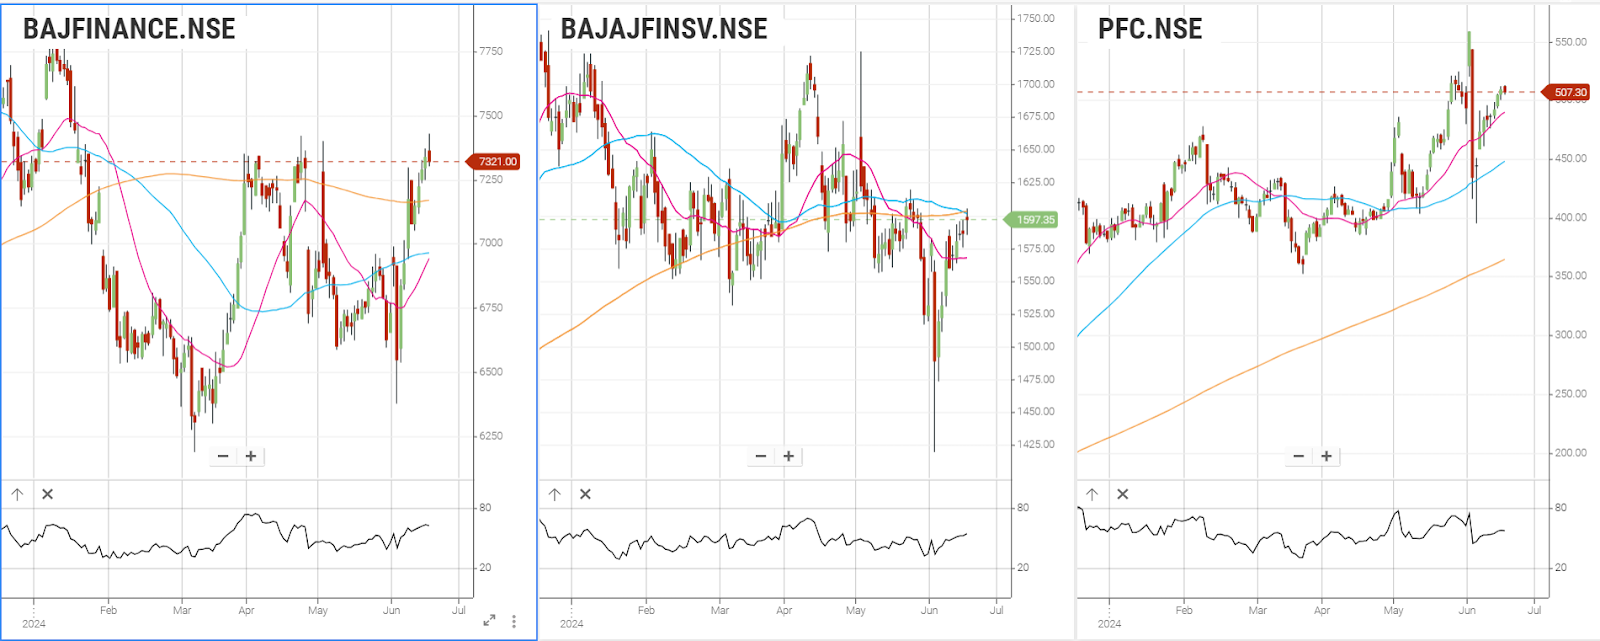
SMA and EMA levels indicate that stock exhibits strong bullish signals. The technical indicators imply that the stocks would be neutral to bearish
Bajaj Finserv Ltd.
SMA and EMA levels indicate that stock exhibits strong bullish signals. The technical indicators imply that the stocks would be neutral to bearish
Power Finance Corporation Ltd.
SMA and EMA levels indicate that stock exhibits bearish signals. The technical indicators imply that the stocks would follow either a bullish or bearish pattern but mostly neutral.
The below chart exhibits the comparative technical study of three Nifty financial services ex- bank stocks based on Moving average crossover signals and Relative strength index for a period of 6 months.
Conclusion
The comparative analysis of the three Nifty financial services ex-bank index stocks reveals distinct strengths and growth potentials in each company. While each stock demonstrates robust financial performance, the differences in their business models, risk profiles, and market strategies offer diverse investment opportunities. Company A excels in innovation and technology adoption, Company B shows strong resilience and consistent returns, and Company C capitalizes on niche markets and specialized services. Investors should consider these factors in alignment with their risk tolerance, investment goals, and market outlook to make informed decisions. Overall, the financial services sector ex-banking continues to show promising growth, driven by increasing demand for diversified financial products and services in India.
Enrich Money’s Orca app provides investors with comprehensive stock momentum analysis. It is advised that investors perform thorough evaluations using both technical and fundamental analysis tools before making any investment choices.
Frequently Asked Questions
What is the Nifty Financial Services Ex-Bank Index?
The Nifty Financial Services Ex-Bank Index is a stock market index that tracks the performance of financial services companies in India, excluding banks. It includes NBFCs, insurance companies, and other financial institutions.
How do Nifty Financial Services Ex-Bank Index stocks differ from banking stocks?
Unlike banking stocks, which are primarily involved in traditional banking activities, Nifty Financial Services Ex-Bank Index stocks encompass a broader range of financial services such as insurance, asset management, and NBFCs, offering more diversified financial exposure.
Why should I consider investing in Nifty Financial Services Ex-Bank Index stocks?
Investing in Nifty Financial Services Ex-Bank Index stocks provides exposure to a diversified portfolio of financial services companies, potentially offering higher growth opportunities and risk mitigation compared to investing solely in banking stocks.
What factors should I consider when investing in Nifty Financial Services Ex-Bank Index stocks?
Key factors to consider include the company's financial health, market position, growth prospects, regulatory environment, and overall economic conditions. Using both technical and fundamental analysis can help make informed investment decisions.
How can I invest in Nifty Financial Services Ex-Bank Index stocks?
You can invest in these stocks through a reliable stockbroker like Enrich Money or trading platforms like Orca . It's important to conduct thorough research or consult with a financial advisor to understand the risks and benefits associated with these investments.
