Top Performing Stocks Under 50 Rs. in 2025
Stocks under 50 Rs. are considered as Penny stocks in the share market. These stocks under 50 Rs. are suitable for novice investors who trades at a moderate budget.
Investing in Stocks under 50 Rs. would help investors to make profit as these stocks have potential to grow in future but at the same time, these stocks are risky too.
Here, you can explore top performing stocks under 50 Rs. with below parameters like market capitalization, PE ratio, 1 year return, 1 month return, total debt and return on equity.
It is advised that the investors must determine their own risk appetite and conduct an in-depth research well before any investments.
Why to Choose Best Stocks?
The success of trading and investment in the Indian Stock Market depends on the stock selected. Choosing the best stock will enable them to make a desirable return at a calculated risk. The success and failure of trading is decided by the stocks that we trade. Hence, its crucial for traders and investors to make a well-informed decision. Traders and Investors are advised to make in depth analysis of the stock before any investment.
Stocks Under 50 Rs Based on Market Capitalization
These performing Stocks under 50 Rs. are gathered based on the stock’s market capitalization between Rs. 5000 crores to Rs.1000000 crores with PE ratio of 0-50. They are ranked on market capitalization from highest to lowest.
|
Stock Name |
Sub Sector |
Market Capitalization in Crores |
Closing Price as on 20.01.2024 |
PE Ratio |
|
Public Banks |
83548.66 |
44.2 |
39.71 |
|
|
Renewable Energy Equipment & Services |
58336.53 |
41.85 |
20.48 |
|
|
Public Banks |
49497.67 |
41.5 |
26.58 |
|
|
Public Banks |
30601.71 |
45.8 |
23.31 |
|
|
Construction & Engineering |
28322.91 |
47.25 |
39.34 |
Stocks Under 50 Rs. Based on 1 Year Return
Stocks under 50 Rs. which have made good 1 year return with PE ratio between 0 -50 and market capitalization between Rs.5000 crore to Rs.1000000 crores
|
Stock Name |
Sub Sector |
Market Capitalization in Crores |
Closing Price as on 20.01.2024 |
PE Ratio |
1 Year Return % |
|
Renewable Energy Equipment & Services |
58336.53 |
41.85 |
20.48 |
333.68 |
|
|
Private Banks |
6435.18 |
30.75 |
8.3 |
68.49 |
|
|
Construction & Engineering |
28322.91 |
47.25 |
39.34 |
54.89 |
|
|
Public Banks |
30601.71 |
45.8 |
23.31 |
43.35 |
|
|
Public Banks |
83548.66 |
44.2 |
39.71 |
41.67 |
Stocks Under 50 Rs. Based on 1 Month Return
Stocks under 50 Rs. which has high 1 month return
|
Stock Name |
Sub Sector |
Market Capitalization in Crores |
Closing Price as on 20.01.2024 |
1 Month Return % |
|
Textiles |
15,417.07 |
31.9 |
36.18 |
|
|
Power Generation |
11,338.27 |
29.55 |
24.48 |
|
|
Textiles |
23021.53 |
45.65 |
22.16 |
|
|
IT Services & Consulting |
7,316.24 |
26.4 |
15 |
|
|
Renewable Energy |
10,931.27 |
15.95 |
13.52 |
Most Active Shares Below Rs 50 based on Highest Volume
Shares below 50 rupees with the market capitalization within Rs.5000 crores and Rs.1000000 crores with highest daily volume .
|
Stock Name |
Sub Sector |
Market Capitalization in Crores |
Closing Price as on 20.01.2024 |
Daily Volume |
|
Private Banks |
71,760.13 |
25.15 |
29,07,89,131.00 |
|
|
Power Generation |
11,338.27 |
29.55 |
13,07,12,010.00 |
|
|
Renewable Energy Equipment & Services |
58336.53 |
41.85 |
13,02,71,353.00 |
|
|
Textiles |
15,417.07 |
31.9 |
6,39,05,789.00 |
|
|
Construction & Engineering |
28322.91 |
47.25 |
4,89,32,409.00 |
Top 20 Stocks Under 50 Rs.
|
Stock Name |
Sub Sector |
Market Capitalization in Crores |
Closing Price as on 20.01.2024 |
PE Ratio |
1Y Return |
1 Month Return % |
|
Public Banks |
83548.66 |
44.2 |
39.71 |
41.67 |
-1.89 |
|
|
Renewable Energy Equipment & Services |
58336.53 |
41.85 |
20.48 |
333.68 |
13.19 |
|
|
Public Banks |
49497.67 |
41.5 |
26.58 |
31.96 |
-1.31 |
|
|
Construction & Engineering |
28322.91 |
47.25 |
39.34 |
54.89 |
9.58 |
|
|
Private Banks |
6435.18 |
30.75 |
8.3 |
68.49 |
9.24 |
|
|
Public Banks |
30601.71 |
45.8 |
23.31 |
43.35 |
-1.53 |
|
|
Iron & Steel |
4,442.32 |
47.35 |
19.58 |
90.16 |
-9.94 |
|
|
Textiles |
15,417.07 |
31.9 |
-17.51 |
121.53 |
36.18 |
|
|
Power Generation |
11,338.27 |
29.55 |
-24.08 |
111.07 |
24.48 |
|
|
Textiles |
23021.53 |
45.65 |
52.23 |
36.68 |
22.16 |
|
|
IT Services & Consulting |
7,316.24 |
26.40 |
52.41 |
48.31 |
15 |
|
|
Renewable Energy |
10,931.27 |
15.95 |
197.24 |
121.53 |
13.52 |
|
|
Private Banks |
71,760.13 |
25.15 |
97.52 |
24.81 |
8.95 |
|
|
Specialized Finance |
7,829.84 |
32.1 |
-37.68 |
140.45 |
4.31 |
|
|
Telecom Services |
73,506.33 |
15.1 |
-2.51 |
104.05 |
7.09 |
|
|
Power Generation |
5,638.69 |
10.60 |
-3.02 |
171.79 |
9.95 |
|
|
Industrial Machinery |
4,980.62 |
42.9 |
135.2 |
119.7 |
-6.44 |
|
|
Construction & Engineering |
4,894.65 |
32.7 |
-175.81 |
60.29 |
0.94 |
|
|
Conglomerates |
4,712.82 |
18.8 |
-3.51 |
93.81 |
-14.09 |
|
|
Lloyds Enterprises Ltd |
- |
4,454.99 |
34.95 |
91.35 |
318.66 |
-13.21 |
Overview of Stocks Under 50 Rs.
Indian Overseas Bank
IOB is a public sector bank provides services like domestic deposits and advances, overseas operations and treasury operations and investments. IREDA signs MoU with IOB to support renewable energy projects in India.
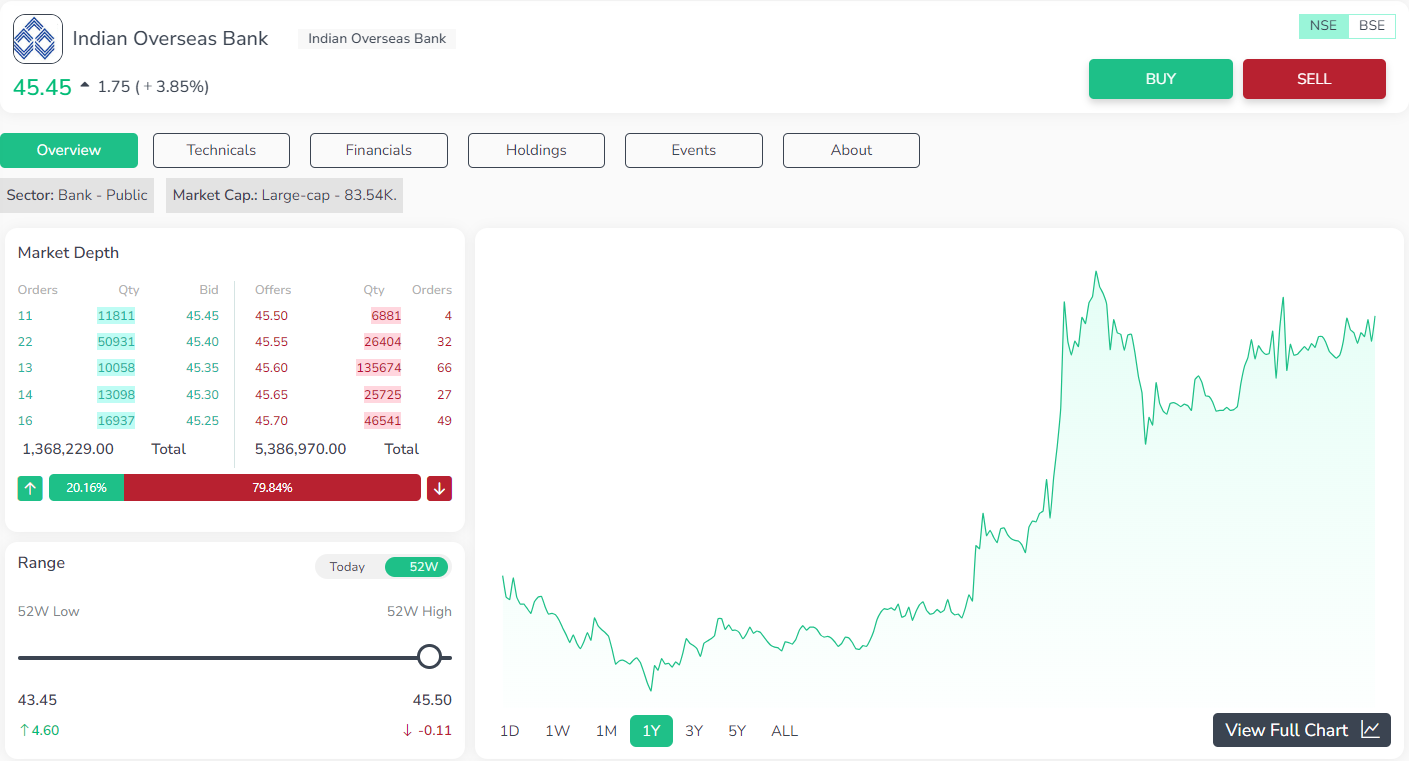
IOB: Stock Analysis
Stock is 4.55 times as volatile as Nifty. IOB’s PE ratio is 39.71 indicating that the price to intrinsic value is 0.943, indicating that the stock is undervalued and is good for investment. Book value of the share for Time to market is 4.31 with year-on-year change to be increasing by 14.37% indicating that the book value is trending up in last 3 years. But the total shareholder’s return is poor to 33.33 and its price to book ratio of 4.31 suggesting that the stock is very expensive in comparison with book value.
Excellent quarter on quarter EPS growth. Annual net profit in last three years is increasing up. EBITDA is found to be trending up for last 3 years. ROE of 11.80% is appreciable. Company has achieved a Net Margin of 10.89%.
But the dividend yield is 0%, Earnings yield is low at 2.74 %. In the last three years, company’s net margin and ROA is found to be very less.
The quarter on quarter is trending up in total sales and net profit by 24.43%. In year-on-year basis, net sales have increased. Quarter sales in increasing in the last 5 years.
Current ratio is calculated to be excellent of 128.18. Company’s liquidity has improved. But the quick ratio indicates that the company is unable to generate cash to support business.
Suzlon Energy Ltd.
Suzlon Ltd. with its subsidiaries manufactures and sells wind turbine generators and related components in India and overseas.
Its Q2FY24 quarterly results has announced that they have established a net debt free balance sheet following the successful completion of QIP. Total revenue for the quarter is of Rs.1417 crore.
Suzlon Energy: Stock Analysis
Book value is increasing. Total shareholder's return value index is 19.44 indicating its status to be very poor. Price to intrinsic value is 2.55 indicating that the stock to be expensive. Enterprise value to EBITDA is 53.74 indicating that the stock is very expensive. Also, the price to book ratio is 50.79.
Net profit margin and operating profit margin has turned to positive numbers. RoCE is 96.11 indicating its strength. Strong RoE of 56.36%.
Also, the annual net profit has increased in the past 3 years. EBITDA is soaring continuously in last 3 years. But the dividend yield is 0%.
It is observed that the company's total assets are decreasing for last 3 years which is a big negative for the company. Also, its debt burden is high of 1.75. But they are trying to pay their debt on yearly basis.
UCO Bank
A public sector financial institution which provides financial services in India and overseas. It accepts deposits, maintains salary accounts, forex dealings, and also provides various types of advances. UCO banks with its brain child 'UCO Empower' aim to fuel growth in MSME sector by supporting and promoting entrepreneurship.
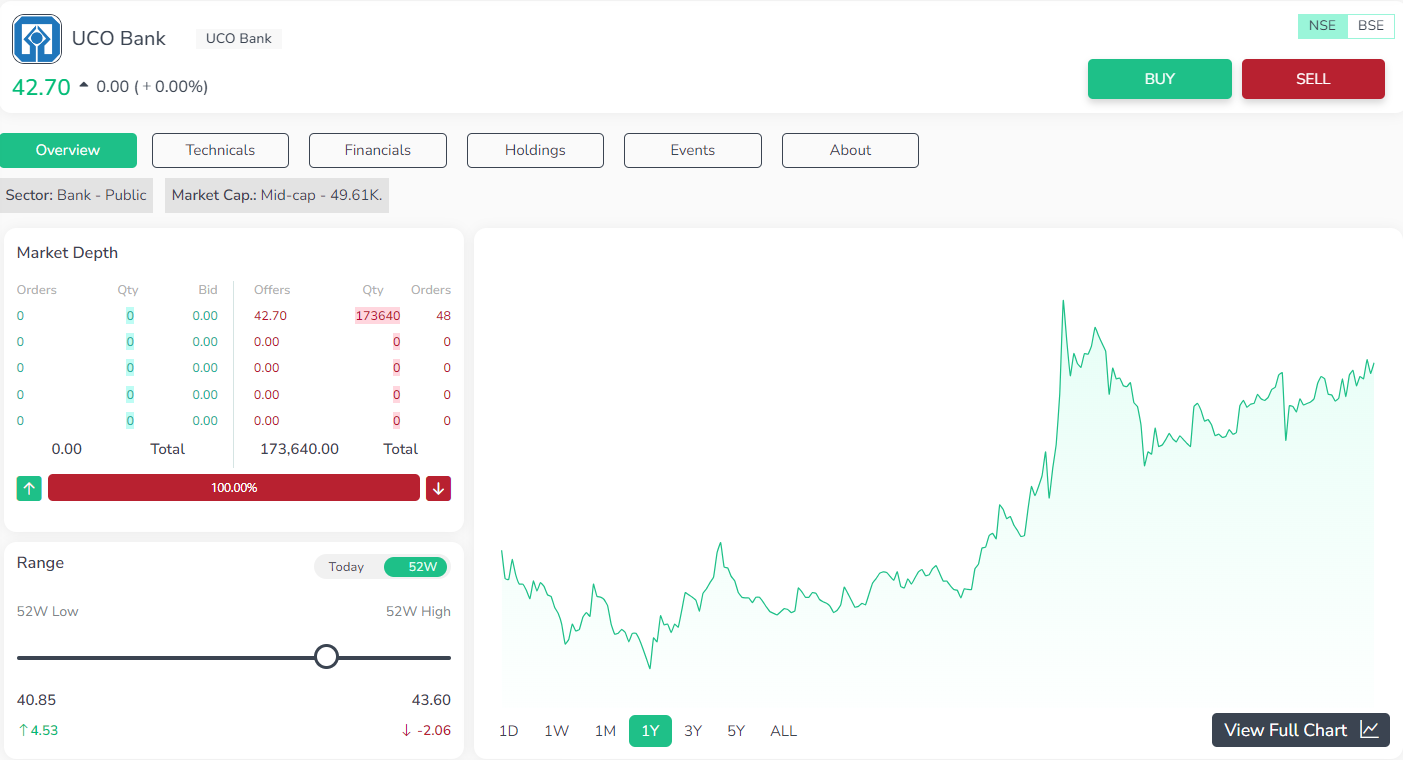
UCO Bank: Stock Analysis
Price to Intrinsic vale is 0.819 indicating that the stock is undervalued and good to buy. Book value in the last three years in increasing. Annual net profit margin and EBITDA is increasing in the last 3 years. but its dividend yield % is 0, earning yield is low at 3.36% and its RoA is not well in the past 3 years.
In sales, the net sale on year-on-year basis has increased multifold to 28572.57%. It has shown positive annual sales with its Total assets increased steadily.
In liquidity, cash ratio is 5.46 and its liquidity has increased.
Punjab & Sind Bank
A public sector bank involved in financial services like treasury, operations, corporate banking, retail banking and other banking operations.
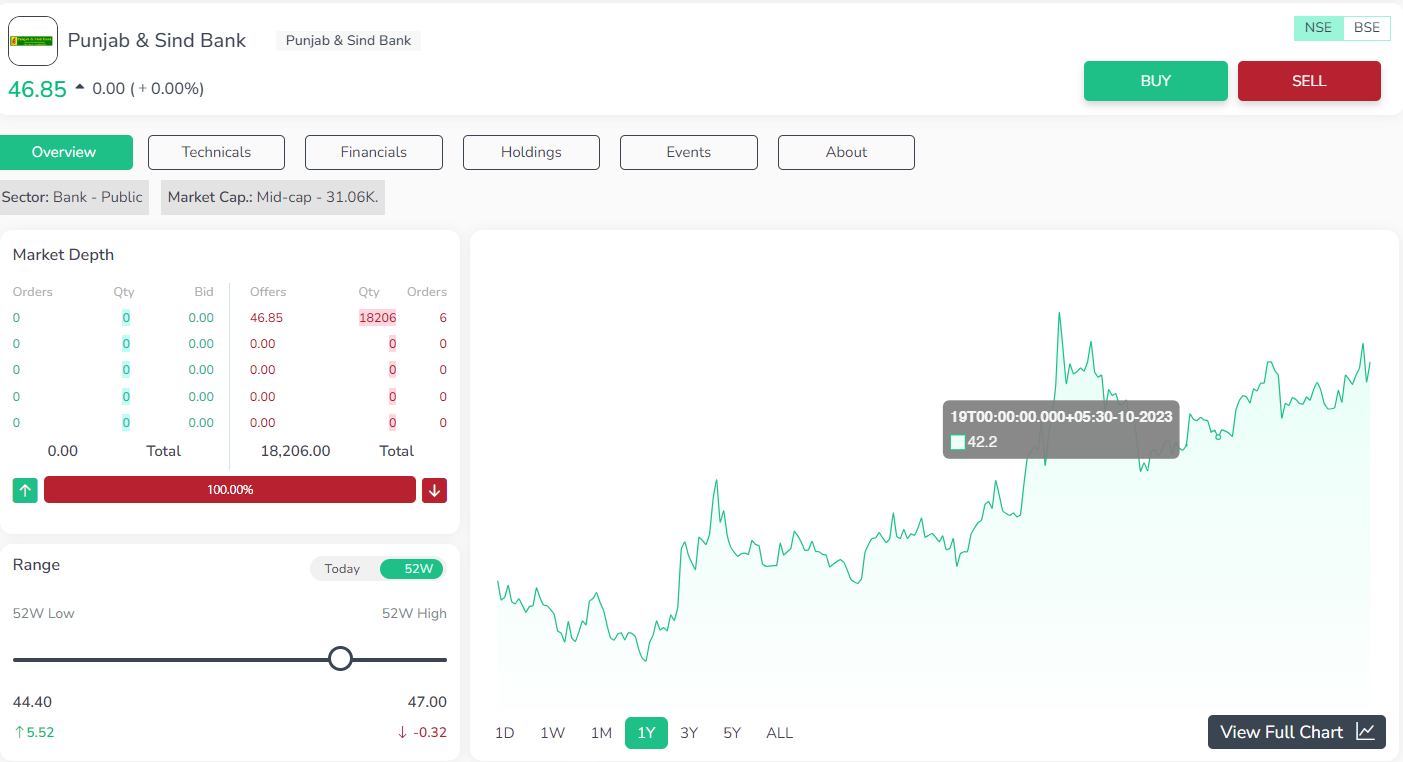
Punjab & Sind Bank: Stock Analysis
The company's price to intrinsic value undervalued to 0.252 indicating that the stock is good to buy. In profitability, over the past 3 years, its annual net profit, EBITDA has trending up. Its net profit margin is 13.12% is appreciable. Earning yield is low at 3.63%, and over the past 3 years, RoA is not good.
In sales, the company has reported a year-on-year net sale growth of 31429.87%. Also, in the last 3 years, its quarterly sales and total assets are steadily increasing. Its Debt burden is within the limits of 0.597. But its interest coverage ratio is negative to -1.63.
IRB Infrastructure Developers Ltd.
IRB involves in business of construction, development, operation and maintenance of roads and highways on build, operate, transfer basis in India. It operates in two divisions; one is toll operate and transfer projects and other is construction.
IRB Infrastructure Developers: Stock Analysis
Stock is undervalued with a price to intrinsic value of 0.732. But its shareholder's return rate score is low to 26.39. Over the last 3 years, EBITDA is positive. But the dividend yield is low to 0.370% and its RoA is also decreasing in the last 3 years. In sales, quarterly reports indicate sales and total assets it to be positive for the past 5 year.
In ratios, the debt recovery ratio has lowered in the last 5 years.
Conclusion
These stocks under 50 Rs. will enable beginners to expose to the trading market at less risk. However, it is essential for the investors and traders to conduct in depth research before investing in these stocks under 50 Rs.
Visit Enrich Money for more information and stock analysis, to invest in stocks under 50 Rs., utilize their free demat account with no annual charges.
Frequently Asked Questions
Is it advisable to invest in stocks under 50 Rs.?
If you follow a value investing approach, considering the potential future returns based on a company's prospects, investing in stocks under 50 Rs. might align with your investment goals.
Where can I obtain information about stocks under 50 Rs.?
You can find details about a stock's fundamentals and other relevant information on the Enrich Money platform.
If I choose to invest in a stock under 50 Rs., can I expect its price to appreciate?
The likelihood of price appreciation depends on the company's fundamentals and growth potential. Thorough research is crucial before making any investment decisions.
Is there a specific time for buying shares or conducting a trade?
Yes, you can only engage in trading on weekdays between 9:15 a.m. and 3:30 p.m. However, after these trading hours, you have the option to place After Market Orders (AMO).
Is investing in stocks under 50 Rs. risky?
Investing in stocks under 50 Rs. carries significant risk, and it is not recommended unless you possess comprehensive knowledge and expertise in this area.
Disclaimer: This blog is dedicated exclusively for educational purposes. Please note that the securities and investments mentioned here are provided for informative purposes only and should not be construed as recommendations. Kindly ensure thorough research prior to making any investment decisions. Participation in the securities market carries inherent risks, and it's important to carefully review all associated documents before committing to investments. Please be aware that the attainment of investment objectives is not guaranteed. It's important to note that the past performance of securities and instruments does not reliably predict future performance.
