Spotting Aggression and Absorption with Trending OI
In derivatives markets, price movement alone rarely reveals the true strength of a move. A breakout may appear decisive on the chart, yet fail within minutes. A decline may look sharp, but reverse just as quickly. What often determines whether a move sustains or fades is not price itself — but the positioning activity unfolding beneath it.
Open Interest becomes meaningful when observed as evolving behavior rather than a static figure. ORCA’s Trending OI module is designed precisely for this purpose: to track how exposure builds, unwinds, or rotates over defined time intervals, allowing traders to distinguish between aggression and absorption during live market conditions.
Observing Flow in Context
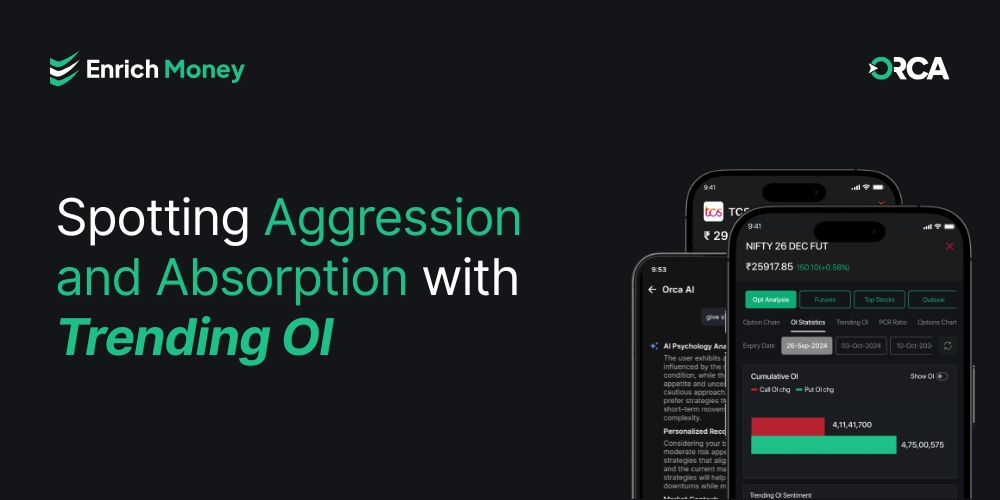
Trending OI begins by anchoring analysis to a specific expiry and time interval, as seen in the screenshot configuration (3-minute interval across selected strikes). This ensures that exposure is measured consistently and within the correct contract cycle.

Once defined, the platform overlays price movement with directional OI flow. This comparison is critical. When price advances while directional OI remains flat or weak, it often suggests that the move lacks aggressive participation. Such conditions may indicate absorption — where existing positions adjust, but fresh conviction is limited.
Conversely, when price movement aligns with strong directional OI expansion, it reflects aggressive positioning. The alignment between price and exposure often precedes sustained continuation.
Trending OI transforms this relationship into a visual framework, enabling traders to assess participation quality rather than reacting solely to volatility.
Understanding Aggression Through Exposure Sequencing
The second layer separates Call and Put OI over time, presenting their evolution as continuous flow rather than isolated spikes.

Instead of manually scanning strike-level data, traders can observe slope behavior and continuity. A steady upward slope in Call OI suggests layered accumulation. Persistent elevation in Put OI indicates structured downside positioning. Sharp vertical reductions may signal forceful unwinding rather than gradual adjustment.
The strength of Trending OI lies in sequencing. Markets rarely shift in a single moment; positioning builds progressively. By visualizing this progression, the module helps identify whether exposure is expanding with conviction or merely fluctuating temporarily.
Structural Confirmation Through Quantified Data
Below the flow charts, the structured table provides measurable confirmation of the evolving bias.

Columns reflecting change in Call OI, change in Put OI, net difference, trend classification, direction percentage, and PCR work collectively to validate what the visual slopes imply.
For instance, sustained negative net difference combined with a bearish classification and elevated PCR indicates that Put dominance is not incidental but structurally consistent. This layered confirmation reduces interpretative noise and strengthens analytical clarity.
Distinguishing Absorption from True Momentum
One of the most valuable applications of Trending OI arises during breakout attempts and volatile sessions. When price breaks higher without proportional Call build-up, it may signal that participants are not aggressively supporting the move. Similarly, a sharp decline without corresponding Put expansion may reflect temporary volatility rather than sustained pressure.
By tracking positioning at defined intervals, Trending OI allows traders to observe whether participation accelerates with price or diverges from it. That distinction often determines whether momentum persists or stalls.
A Behavioral Lens, Not a Signal Generator
Trending OI does not attempt to predict direction. Instead, it reframes Open Interest as a behavioral lens into real-time market participation.
By integrating interval-based tracking, strike clustering, price comparison, and structured confirmation within a single interface, ORCA transforms Open Interest from a static metric into a live participation indicator.
In fast-moving derivatives markets, positioning frequently reveals intent before price fully confirms it. Trending OI makes that intent observable.
Frequently Asked Questions
-
What does Trending OI primarily measure?
It measures how Call and Put Open Interest evolve over defined time intervals to reveal participation behavior.
-
How does it help identify absorption?
Absorption appears when price moves but OI Direction does not expand proportionally, indicating weak positioning support.
-
What signals aggressive positioning?
Strong, continuous OI expansion aligned with price movement indicates aggressive build-up.
-
Why is the time interval important?
Defined intervals help sequence exposure changes, making it easier to detect sustained trends versus short-term fluctuations.
-
Is Trending OI useful only during volatile sessions?
No. It is equally valuable during range-bound markets to detect compression, rotation, or gradual build-up.
Disclaimer: This blog is dedicated exclusively for educational purposes. Please note that the securities and investments mentioned here are provided for informative purposes only and should not be construed as recommendations. Kindly ensure thorough research prior to making any investment decisions. Participation in the securities market carries inherent risks, and it's important to carefully review all associated documents before committing to investments. Please be aware that the attainment of investment objectives is not guaranteed. It's important to note that the past performance of securities and instruments does not reliably predict future performance.