Comparative Analysis of Nifty Non – Cyclical Consumer Index : Stability in Every Market Condition
Non-Cyclical Companies
Non-cyclical companies produce goods which have steady demand in all phases of the economic cycle. The share price movements of cyclical company’s stocks are independent of GDP growth. Consumers of non-cyclical goods purchase them steadily at any phase of the economy.
Example : Food, Household products etc.
Nifty Non -Cyclical Consumer Index
NSE has created Nifty Non-Cyclical Consumer Index under its Thematic Indices which tracks and monitors the stocks of the listed companies which have non-cyclical consumers has its consumer base. Nifty Non-cyclical consumer index consists of companies form FMCG, consumer durables, consumer services, telecommunication, media , entertainment & publication, textiles and services
Eligibility Criteria for Nifty Non -Cyclical Consumer Index Stocks
The stocks which are part of Nifty 500 are considered for eligibility into nifty non-cyclical consumer index. The companies which are classified as Basic Industry like Diversified FMCG, Diversified Foods, Packaged Foods, Tea & Coffee, Personal Care etc. are shortlisted for inclusion in Nifty Non - Cyclical Consumer Index. Among the shortlisted basic industry companies, the top most 30 companies are selected based on six months mean of free float market capitalization methods. These top 30 stocks are provided weightage based on free float market capitalization. With stock capitalization of 10% each . These Nifty Non - Cyclical Consumer stocks are reviewed on a half yearly basis.
Constituents of Nifty Non – Cyclical Consumer Index
|
Company Name |
Industry |
Weightage |
|
Bharti Airtel Ltd. |
Telecommunication |
10.15% |
|
ITC Ltd. |
Fast Moving Consumer Goods |
9.98% |
|
Hindustan Unilever Ltd. |
Fast Moving Consumer Goods |
9.97% |
|
Titan Company Ltd. |
Consumer Durables |
6.41% |
|
Asian Paints Ltd. |
Consumer Durables |
5.94% |
|
Zomato Ltd. |
Consumer Services |
5.59% |
|
Trent Ltd. |
Consumer Services |
5.45% |
|
Nestle India Ltd. |
Fast Moving Consumer Goods |
4.11% |
|
Varun Beverages Ltd. |
Fast Moving Consumer Goods |
3.54% |
|
Avenue Supermarts Ltd. |
Consumer Services |
3.19% |
|
Britannia Industries Ltd. |
Fast Moving Consumer Goods |
|
|
Colgate Palmolive (India) Ltd. |
Fast Moving Consumer Goods |
|
|
Crompton Greaves Consumer Electricals Ltd. |
Consumer Durables |
|
|
Dabur India Ltd. |
Fast Moving Consumer Goods |
|
|
Dixon Technologies (India) Ltd. |
Consumer Durables |
|
|
FSN E-Commerce Ventures Ltd. |
Consumer Services |
|
|
Godrej Consumer Products Ltd. |
Fast Moving Consumer Goods |
|
|
Havells India Ltd. |
Consumer Durables |
|
|
Indian Hotels Co. Ltd. |
Consumer Services |
|
|
Indian Railway Catering And Tourism Corporation Ltd. |
Consumer Services |
|
|
Info Edge (India) Ltd. |
Consumer Services |
|
|
InterGlobe Aviation Ltd. |
Services |
|
|
Jubilant Foodworks Ltd. |
Consumer Services |
|
|
Marico Ltd. |
Fast Moving Consumer Goods |
|
|
Page Industries Ltd. |
Textiles |
|
|
Tata Communications Ltd. |
Telecommunication |
|
|
Tata Consumer Products Ltd. |
Fast Moving Consumer Goods |
|
|
United Spirits Ltd. |
Fast Moving Consumer Goods |
|
|
Voltas Ltd. |
Consumer Durables |
|
|
Zee Entertainment Enterprises Ltd. |
Media Entertainment & Publication |
|
Performance of Nifty Non-Cyclical Consumer Index
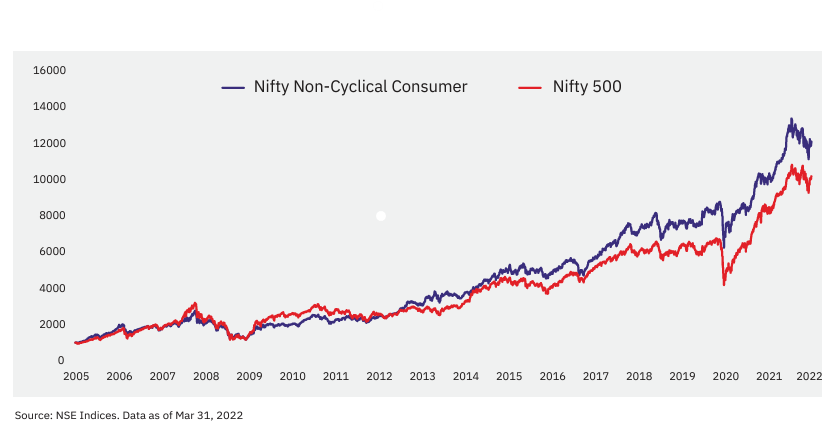
As on 31st March, 2022, Nifty Non - cyclical consumer index has performed better than Nifty 500 index over long term periods since inception, 5 , 7-, 10- and 15-years period. But when comparing the performance for a short-term period like YTD, 3 months and 6 months it indicates that Nifty 500 has performed better than Nifty Non - Cyclical consumer index.
Since Nifty Non - Cyclical Consumer Index inception on 1st April, 2005 , the index has delivered a return in terms of compounded annual growth rate of 15.8% whereas Nifty 500 has delivered 14.6%. The volatility of the nifty non-cyclical consumer index since inception is 19.6% whereas Nifty 500 is 21.5%. The Risk return ratio of Nifty non-cyclical consumer index is 0.81 whereas Nifty 500 is 0.68.
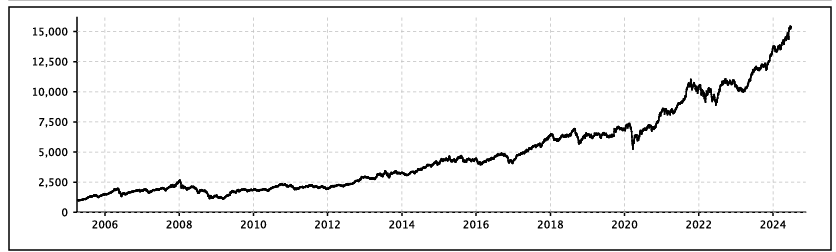
The below image is the performance of Nifty Non-cyclical Consumer Index as on 28th June, 2024.
Nifty Non -Cyclical Consumer Index Stock Comparison
To analyze the Nifty Non – Cyclical Consumer index stocks, let’s consider three of the Nifty Non – Cyclical Consumer Index stocks for comparative analysis.
Unlock your financial potential with Enrich Money's cutting-edge digital investing platform. Open a free demat trading account today and let Enrich Money guide you towards a prosperous future in wealth tech management.
Let’s consider the below stocks for comparative analysis.
Intraday Price Comparative Analysis
|
Stock Name (as of 5th July, 2024) |
Bharti Airtel Limited |
ITC Limited |
Hindustan Unilever Limited |
|
Open (INR) |
Rs.1422.50 |
Rs.429 |
Rs.2495.95 |
|
High (INR) |
Rs.1433.60 |
Rs.433.90 |
Rs.2537.55 |
|
Low (INR) |
Rs.1416.85 |
Rs.427.60 |
Rs.2495.95 |
|
Last Traded Price (INR) |
Rs.1422.30 |
Rs.432.50 |
Rs.2531.85 |
|
Volume |
3054598 |
8363827 |
972735 |
|
Previous Close (INR) |
Rs.1423.05 |
Rs.429.05 |
Rs.249595 |
On the basis of intraday price analysis, Hindustan Unilever Limited has the strongest intraday performance while ITC has the highest trading activity.
Monthly Price Comparative Analysis
|
Stock Name |
Bharti Airtel Limited |
ITC Limited |
Hindustan Unilever Limited |
|
Date |
Closing Price in INR |
||
|
Jul 5, 2024 |
1,429.70 |
433.65 |
2,547.00 |
|
Jul 1, 2024 |
1,423.05 |
429.05 |
2,495.95 |
|
Jun 1, 2024 |
1,444.05 |
424.9 |
2,473.05 |
|
May 1, 2024 |
1,372.75 |
426.45 |
2,329.05 |
|
Apr 1, 2024 |
1,322.30 |
435.65 |
2,230.45 |
|
Mar 1, 2024 |
1,228.60 |
428.35 |
2,264.35 |
|
Feb 1, 2024 |
1,123.35 |
406.3 |
2,412.30 |
|
Jan 1, 2024 |
1,170.70 |
441.55 |
2,481.55 |
|
Dec 1, 2023 |
1,032.20 |
462.1 |
2,663.95 |
|
Nov 1, 2023 |
1,014.70 |
435.8 |
2,545.55 |
|
Oct 1, 2023 |
914.4 |
428.4 |
2,484.00 |
|
Sep 1, 2023 |
926.4 |
444.4 |
2,465.60 |
|
Aug 1, 2023 |
856.4 |
439.7 |
2,505.05 |
While observing the monthly stock price data, the stock price of Bharti Airtel Limited has increased tremendously indicating strong growth prospects.
Chart Analysis
Bharti Airtel Limited
Bharti Airtel Limited , an Indian telecommunications company which operates in the business of mobile, broadband, and digital TV services to Asia and Africa with 4G and 5G network. The company has other diverse businesses like Airtel Payments Bank, Wynk music etc.
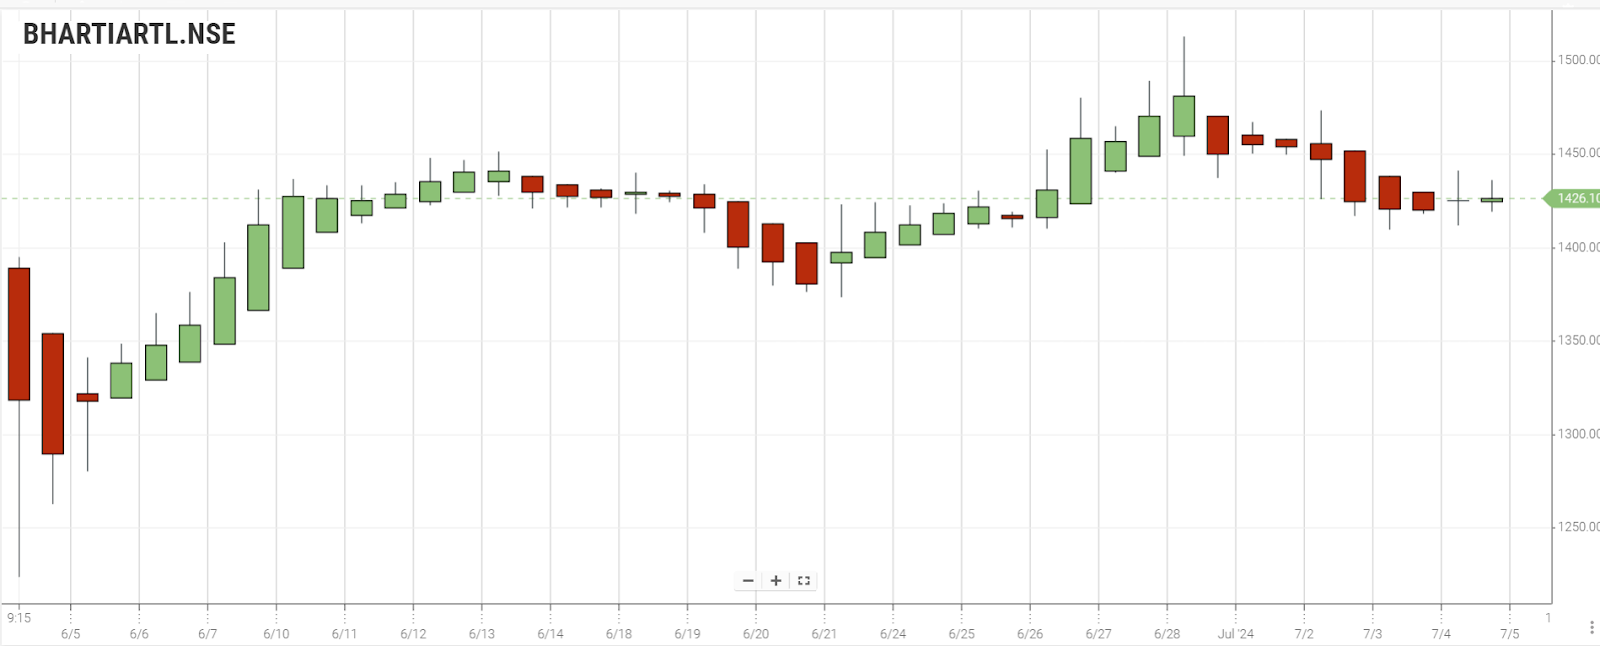
Bearish Initiation Heikin Ashi pattern is formed on Bharti Airtel daily charts. Bullish Heikin Ashi pattern with high volume is observed on weekly charts. The Bullish Initiation Heikin Ashi pattern is formed in monthly charts.
ITC Limited
ITC Limited , an Indian conglomerate which operates in the business of FMCG, hotels, paperboards, packaging, agribusiness, and IT. Its popular brands are Aashirvaad, Sunfeast, and Bingo.
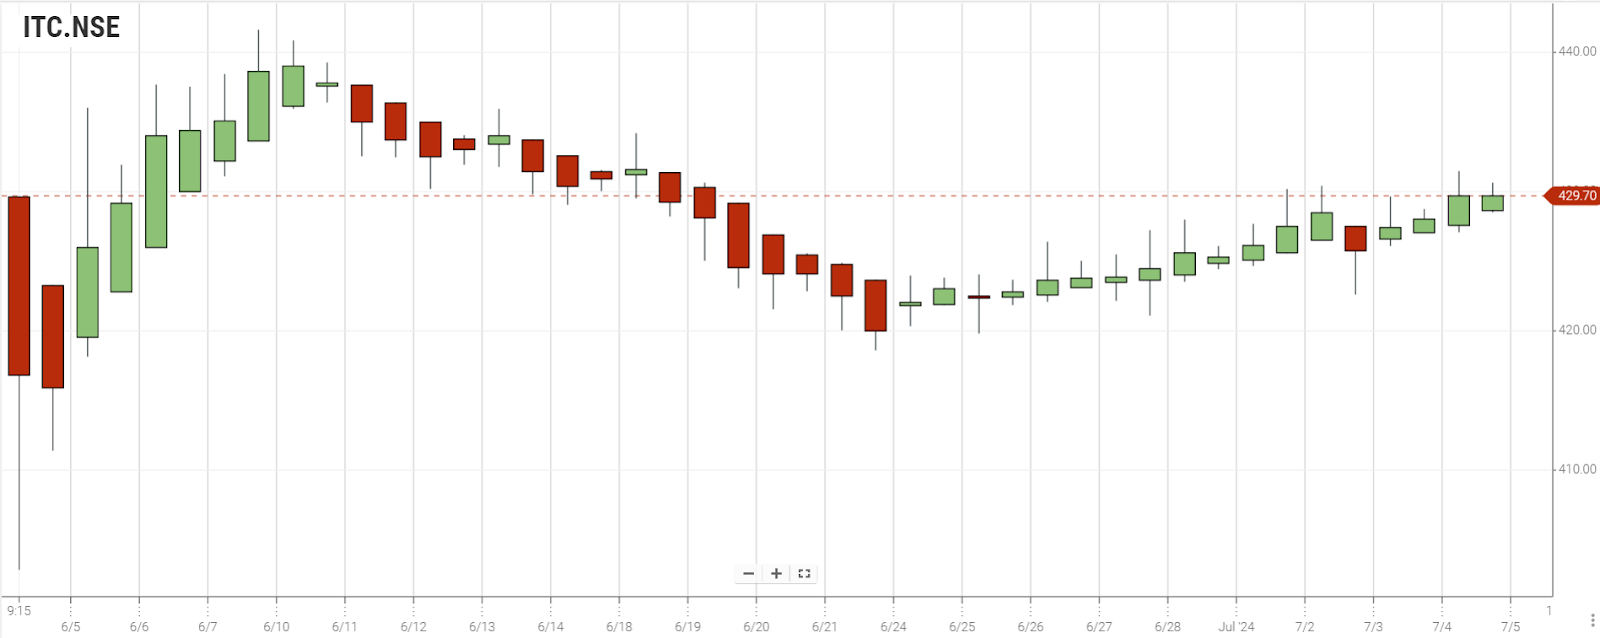
Consolidation Heikin Ashi pattern with spinning top is formed on ITC daily charts. Bullish Heikin Ashi pattern with a bullish tick from red to green is observed on weekly charts. Bearish Heikin Ashi pattern with bearish tick from green to red is formed in monthly charts.
Hindustan Unilever Limited
Hindustan Unilever Limited a consumer goods company, known for its wide range of products in sectors like personal care, home care, and food & beverages. The company boasts a portfolio of well-known brands such as Lux, Dove, Surf Excel, and Lipton. HUL is renowned for its extensive distribution network and strong commitment to sustainability and social responsibility. It remains a dominant player in the Indian FMCG market, consistently delivering strong financial performance.
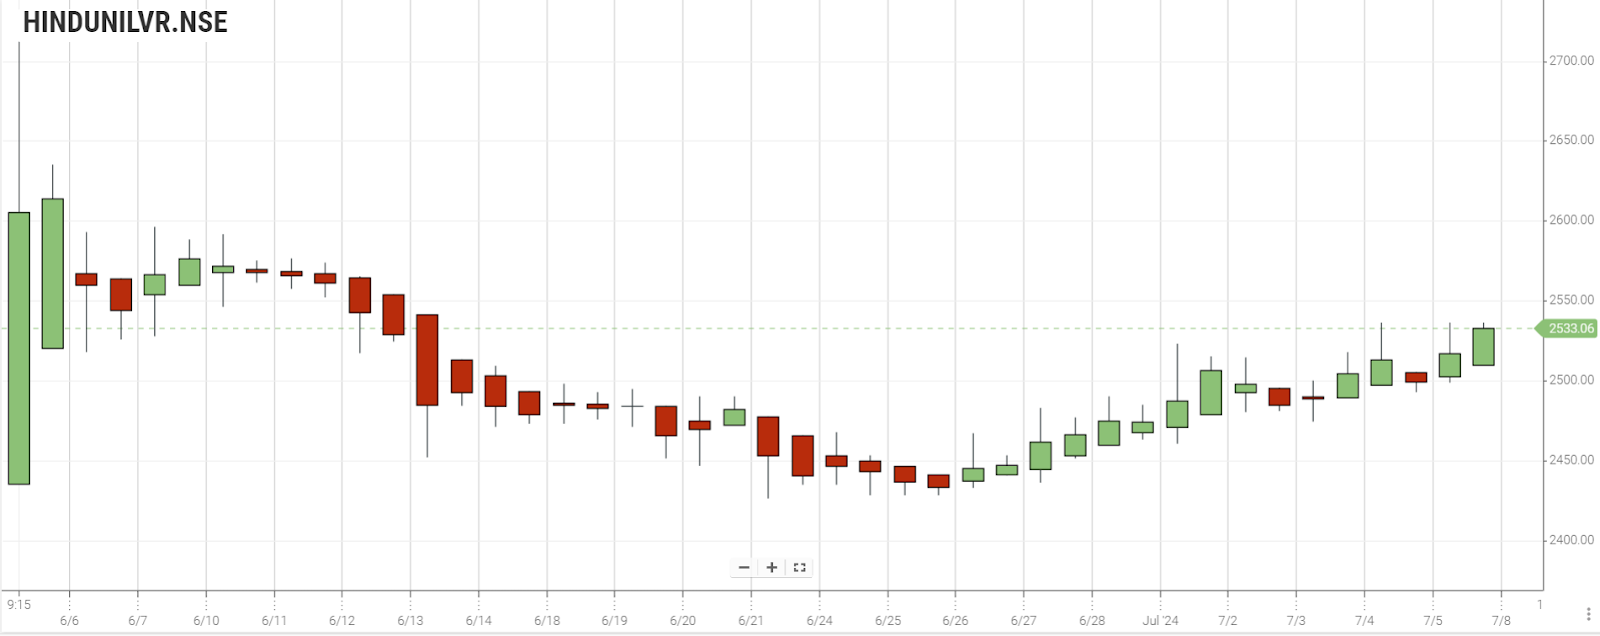
The Bullish Continuation Heikin Ashi pattern is formed on Hindustan Unilever Limited’s monthly charts . Bullish Heikin Ashi pattern with a bullish tick from red to green is formed in weekly charts.
Based on the chart analysis, Bharti Airtel Limited and Hindustan Unilever Limited would follow a long-term growth trajectory while ITC Limited provides mixed signals suggesting caution.
Fundamental Analysis
Bharti Airtel Limited
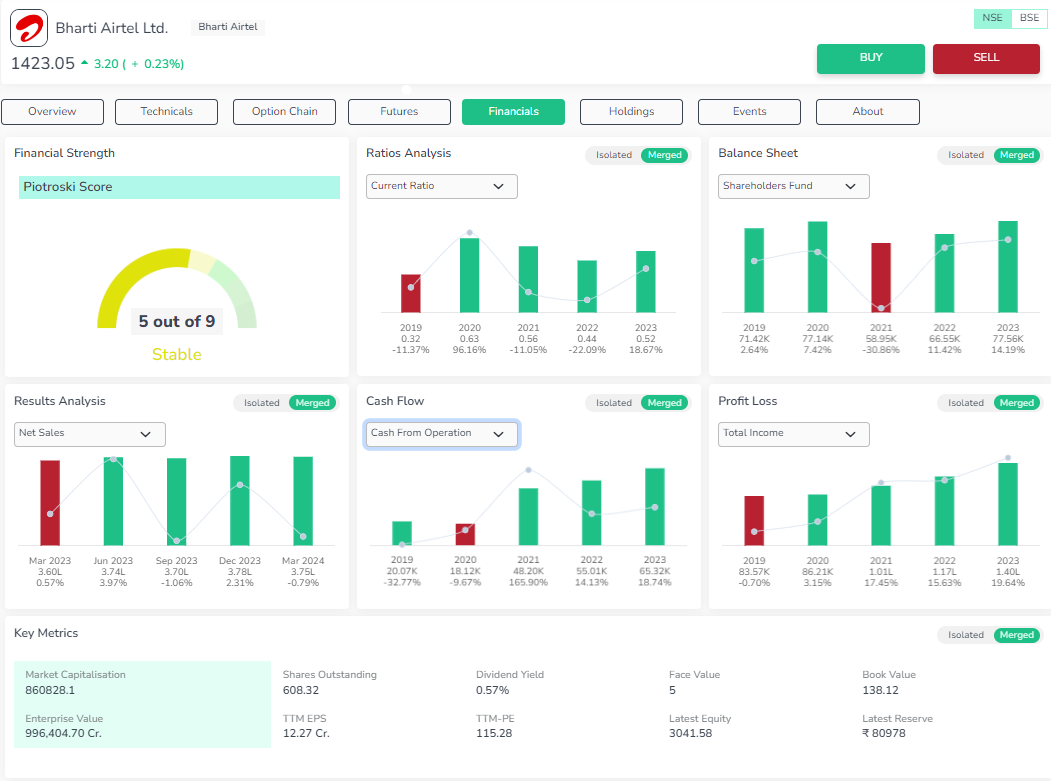
Valuation – The price to intrinsic value of the stock indicates that the stock is undervalued. Book value of the stock has been uptrend in the last 3 years. But the price to book ratio indicates that the stock is overpriced.
Profitability – EBITDA is in uptrend in the last three years. The company has low profitability and yields a very low dividend and poor Return on assets.
Growth – Annual sales of the company have been in uptrend in the last three years.
Stability – Companies have a high debt burden.
ITC Limited
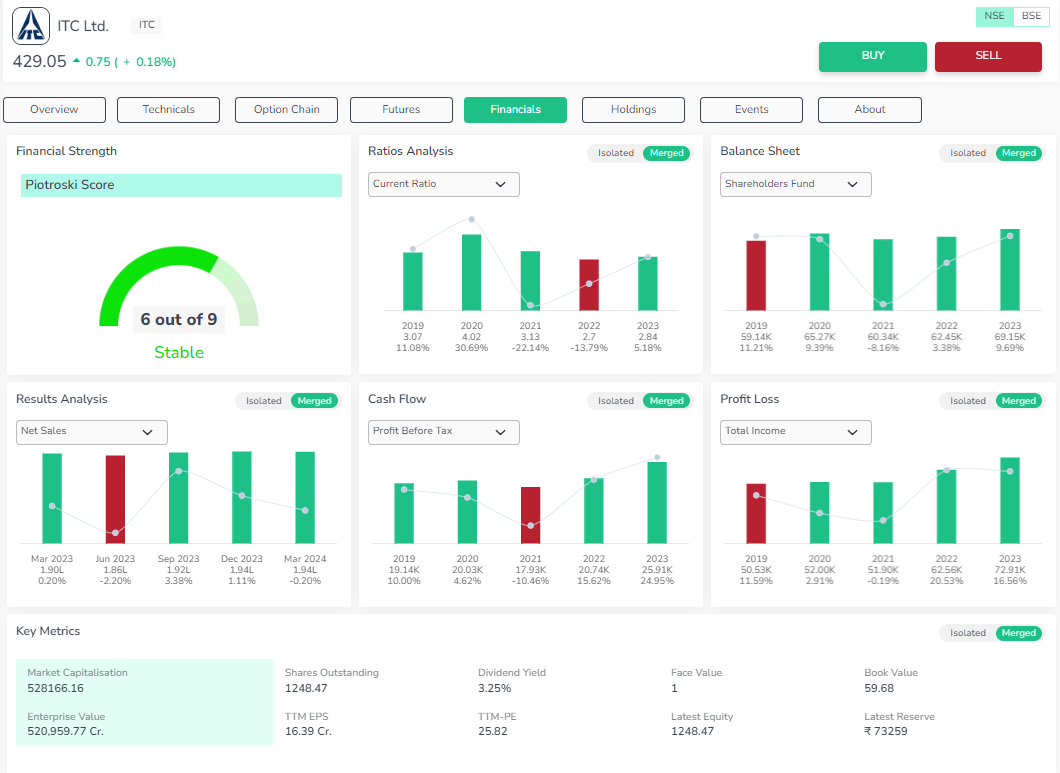
Valuation – Book value of the stock has been uptrend in the last three years. But the price to book ratio indicates that the stock is overpriced.
Profitability – Company has excellent profitability with positive numbers on net margin, Return on equity, return on assets, RoCE and net profit. The company’s yield on dividend is stable. But the stock's earning yield is low.
Growth – Annual sales of the company and total assets are in uptrend in the last three years.
Stability – The company has average stability in maintaining its liquidity to meet its daily operations.
Hindustan Unilever Limited
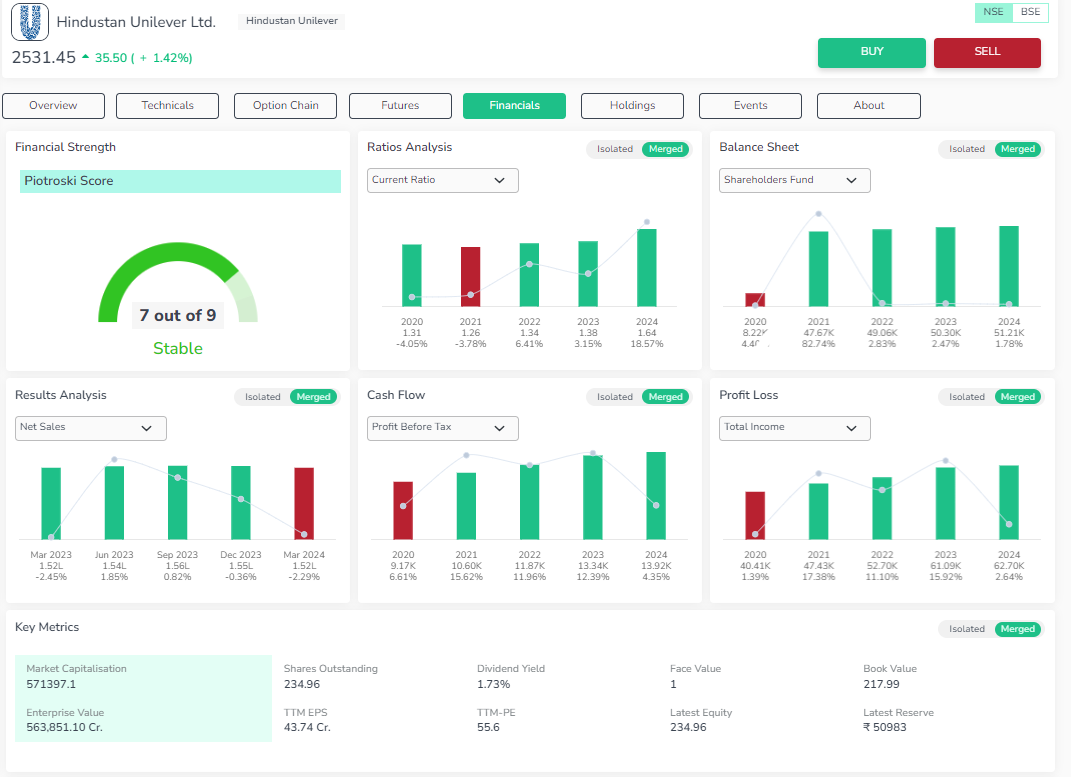
Valuation – Book value of the stock has been uptrend in the last three years. But the price to earnings ratio and price to book ratio indicates that the stocks are overpriced.
Profitability – Company’s profitability parameters like company’s earnings, RoE, net profit margin, EBITDA, RoCE are in uptrend in the past three years.
Growth – The company has a steady uptrend in sales and total assets.
Stability – The company has paid more than half of its debt burdens.
Based on the fundamental analysis, Bharti Airtel shows growth in annual sales and book value but needs to improve its profitability and reduce debt burden. ITC Limited exhibits excellent profitability and growth in sales and assets, even though the stock appears overpriced. Its stability is average. Hindustan Unilever demonstrates strong profitability, steady growth, and improving debt management, but is also considered overpriced. Overall, Hindustan Unilever Limited shows the strongest financial performance and stability, ITC is profitable but requires caution due to valuation concerns, while Bharti Airtel has growth potential but faces significant debt and low profitability challenges.
Technical Analysis
Gain deep insights into stock performance with the Orca app. Access detailed technical and fundamental analysis instantly. Download today
|
Technical Analysis @ 05.07.2024 |
|||
|
Stock Name |
Bharti Airtel Limited |
ITC Limited |
Hindustan Unilever Limited |
|
Moving Averages |
|||
|
SMA 20 Days |
1304.46 |
435.78 |
2275 |
|
EMA 20 Days |
1288.49 |
433.29 |
2294.7 |
|
SMA 200 Days |
1047.65 |
440.28 |
2454 |
|
EMA 200 Days |
1075.94 |
432.33 |
2428 |
|
Indicators |
|||
|
RSI |
59.54 |
47.26 |
55.68 |
|
CCI |
-4.23 |
-68.18 |
78.11 |
|
WILLIAMS_R |
-43.75 |
-92.22 |
-28.78 |
|
UO |
52.34 |
41.01 |
53.69 |
|
Rate of Change |
0.92 |
-2.55 |
4.48 |
|
MACD |
14.15 |
0.76 |
20.91 |
|
ADX |
0 |
0 |
0 |
|
Standard Pivot Levels |
|||
|
R4 |
1337.1 |
429.85 |
2350.6 |
|
R3 |
1330.78 |
429.33 |
2343.43 |
|
R2 |
1324.47 |
428.82 |
2336.27 |
|
R1 |
1320.23 |
428.53 |
2332.03 |
|
Pivot |
1313.92 |
428.02 |
2324.87 |
|
S1 |
1309.68 |
427.73 |
2320.63 |
|
S2 |
1311.83 |
427.78 |
2324.93 |
|
S3 |
1299.13 |
426.93 |
2309.23 |
|
S4 |
1294.9 |
426.65 |
2305 |
Bharti Airtel Limited
SMA and EMA levels indicate that stock exhibits bearish signals. The technical indicators imply that the stocks would follow a bullish signal.
ITC Limited
SMA and EMA levels indicate that stock exhibits strong bullish signals. The technical indicators show that the stocks remain neutral.
Hindustan Unilever Limited
SMA and EMA levels indicate that stock exhibits bullish signals. The technical indicators show that the stocks are bullish.
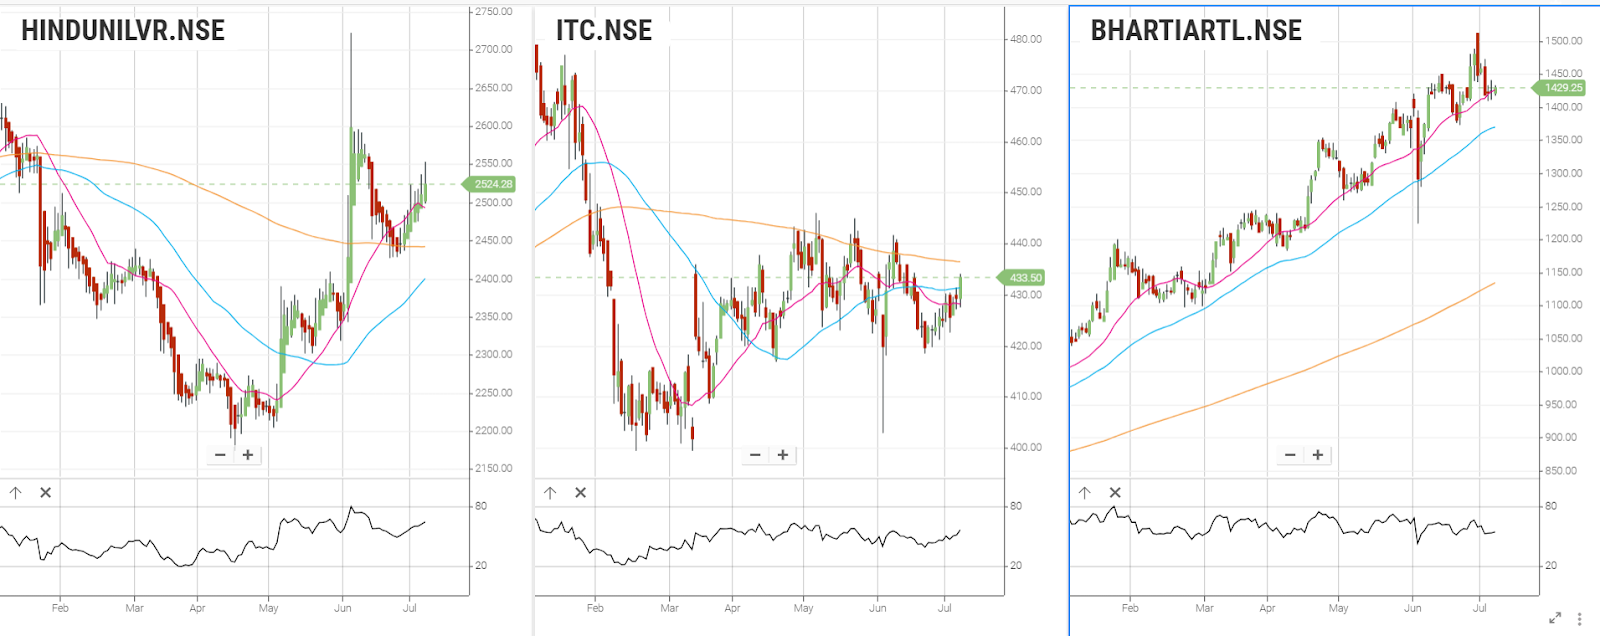
The below chart exhibits the comparative technical study of three Nifty Non – Cyclical Consumer Index stocks based on Moving average crossover signals and Relative strength index for a period of 6 months.
Based on SMA and EMA signals and technical indicators, Bharti Airtel stocks exhibit bearish signals with possible bullish patterns, ITC displays strong bullish signals with neutral indicating stability and Hindustan Unilever exhibits bullish signals indicating investors’ confidence.
Conclusion
Nifty Non-Cyclical Consumer Index offers a stable investment option across economic cycles. This index consists of leading companies from diverse sectors such as FMCG, consumer durables, and telecommunications, the index consistently performs well over long-term periods. The Nifty Non-Cyclical Consumer Index provides investors with a balanced and reliable investment avenue, particularly for long-term growth.
The Enrich Money Orca app offers investors comprehensive insights into stock momentum trends. It is recommended that investors conduct thorough evaluations utilizing both technical and fundamental analysis tools before making any investment decisions.
Frequently Asked Questions
How can I analyze and invest in Nifty Non-Cyclical Consumer Index stocks through Enrich Money?
Enrich Money provides a user friendly investment platform for investors to invest in Nifty Non-Cyclical Consumer Index stocks. This tool provides a detailed analysis and forecast of each stock. Open a demat account, fund it, and start trading using our user-friendly interface.
Where can I access the mutual fund scheme of Nifty Non -Cyclical Consumer Index?
You can access, analyze and invest in mutual fund schemes of Nifty Non- Cyclical Consumer Index through Enrich Money.
What are cyclical companies?
Cyclical companies are those whose goods find relatively increase in demand at times of economic growth and relatively decrease in demand at times of economic downturn. The share price movement of cyclical company’s stocks are dependent on GDP growth .
What is the NIFTY Non-Cyclical Consumer Index?
The NIFTY Non-Cyclical Consumer Index consists of stocks of companies producing essential goods classified as basic industries like FMCG, telecommunications, and consumer durables. These companies have stable demand irrespective of economic conditions.
What data is available for the NIFTY Non-Cyclical Consumer Index?
Data available are historical data, sector-wise break-up, and individual stock weightages. Investors can access detailed information such as CAGR, beta values, and drawdowns. This data helps in making informed investment decisions.
Related Resource
Disclaimer: This blog is dedicated exclusively for educational purposes. Please note that the securities and investments mentioned here are provided for informative purposes only and should not be construed as recommendations. Kindly ensure thorough research prior to making any investment decisions. Participation in the securities market carries inherent risks, and it's important to carefully review all associated documents before committing to investments. Please be aware that the attainment of investment objectives is not guaranteed. It's important to note that the past performance of securities and instruments does not reliably predict future performance.