Nifty Midcap150 Momentum 50 Index: Structure, Performance, and Top Stock Picks

Introduction
The Nifty Midcap150 Momentum 50 Index has been designed to track the performance of the 50 most dynamic companies from the Nifty Midcap 150 universe. These companies are chosen based on their Normalized Momentum Score, which considers both 6-month and 12-month price returns adjusted for volatility. This ensures that the index reflects the strength and consistency of stocks that are able to sustain positive momentum. Stock weights are determined using a combination of each company’s momentum score and its free-float market capitalization, with limits applied to avoid overconcentration.
Launched on August 16, 2022, with a base date of April 1, 2005, and a base value of 1000, the index serves as a useful benchmark for investors and is also used for creating index funds, ETFs, and structured products.
Portfolio Characteristics
The Nifty Midcap150 Momentum 50 follows a tilt-weighted methodology, with rebalancing carried out semi-annually in June and December. It consists of 50 stocks, selected and adjusted based on eligibility criteria to ensure liquidity and stability.
|
Characteristic |
Details |
|
Methodology |
Tilt Weighted |
|
No. of Constituents |
50 |
|
Launch Date |
August 16, 2022 |
|
Base Date |
April 01, 2005 |
|
Base Value |
1000 |
|
Calculation Frequency |
Real-Time |
|
Index Rebalancing |
Semi-Annually |
Sector Representation
The index provides exposure across multiple industries, with financial services having the largest weightage. This is followed by healthcare, chemicals, and capital goods, ensuring a balanced allocation across sectors while focusing on momentum leaders.
|
Sector |
Weight (%) |
|
Financial Services |
29.72 |
|
Healthcare |
12.86 |
|
Chemicals |
12.61 |
|
Capital Goods |
11.69 |
|
Information Technology |
6.85 |
|
Consumer Durables |
4.75 |
|
Construction Materials |
3.46 |
|
Telecommunication |
3.2 |
|
Consumer Services |
2.97 |
|
Textiles |
2.41 |
|
Oil, Gas & Consumable Fuels |
2.28 |
|
Automobile & Auto Components |
2.23 |
|
Fast Moving Consumer Goods |
2.15 |
|
Metals & Mining |
1.97 |
|
Construction |
0.52 |
|
Diversified |
0.33 |
Top Constituents by Weightage
The index is led by companies such as Max Healthcare Institute Ltd., Max Financial Services Ltd., BSE Ltd., and Suzlon Energy Ltd., each holding significant weight in the portfolio. The top ten constituents collectively account for a substantial portion of the index, reflecting the role of high-momentum stocks in driving returns.
|
Company |
Weight (%) |
|
5.13 |
|
|
4.49 |
|
|
4.44 |
|
|
4.28 |
|
|
3.74 |
|
|
3.73 |
|
|
3.39 |
|
|
3.33 |
|
|
3.12 |
|
|
3.08 |
Performance and Risk Profile
The index has delivered robust long-term returns, although short-term performance has shown volatility in line with broader market conditions. Over a five-year period, the total return stands at 33.66%, significantly outpacing the short-term returns.
|
Period |
Price Return (%) |
Total Return (%) |
|
QTD |
-3.84 |
-3.73 |
|
YTD |
-4.92 |
-4.63 |
|
1 Year |
-6.72 |
-6.31 |
|
5 Years |
32.83 |
33.66 |
|
Since Inception |
22.41 |
23.65 |
The risk statistics show that the index has a standard deviation of 21.29 since inception, a beta of 0.81 relative to the Nifty 50, and a correlation of 0.80 with the benchmark index. This indicates that while it is more volatile than large-cap indices, it maintains a reasonably strong correlation with the broader market.
|
Statistic |
1 Year |
5 Years |
Since Inception |
|
Std. Deviation |
21.73 |
19.02 |
21.29 |
|
Beta (Nifty 50) |
1.23 |
0.97 |
0.81 |
|
Correlation (Nifty 50) |
0.76 |
0.74 |
0.8 |
Fundamentals
From a valuation standpoint, the index trades at a higher multiple, reflecting its composition of growth-oriented momentum stocks. The price-to-earnings ratio stands at 43.32, while the price-to-book ratio is 7.08. The dividend yield is relatively low at 0.57%, underlining the fact that these companies focus more on growth and reinvestment rather than dividend payouts.
|
Metric |
Value |
|
P/E |
43.32 |
|
P/B |
7.08 |
|
Dividend Yield |
0.57 |
Spotlight on the Index’s Top Five Constituents
-
Max Healthcare Institute Ltd.
Max Healthcare, the largest constituent of the Nifty Midcap150 Momentum 50 Index with a 5.13% weight, has been a strong momentum player in the healthcare sector. The company has delivered a solid 28.36% profit growth over three years, remains virtually debt-free, and enjoys a robust interest coverage ratio of 20.56. Its consistent operating margins of 26.88% and efficient cash conversion cycle of -140.61 days highlight strong financial discipline, further supported by a healthy CFO/PAT of 1.15.
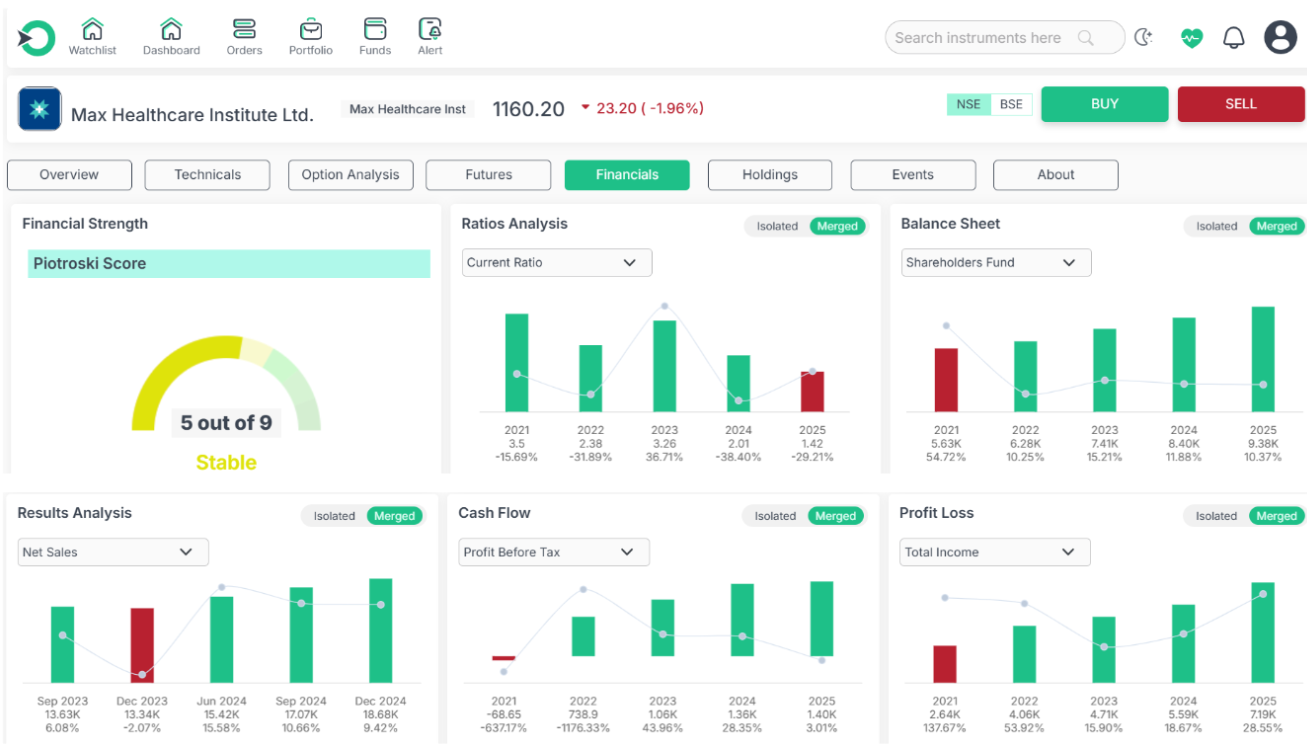
However, growth on the revenue front has been modest at 14.48% CAGR, and contingent liabilities of Rs. 2,012.53 crore pose potential risks. The stock also trades at expensive valuations, with a P/E of 161.37 and EV/EBITDA of 94.03.
Despite these concerns, its financial strength and operational efficiency explain why Max Healthcare continues to be a top contributor to the Nifty Midcap150 Momentum 50 Index.
-
Max Financial Services Ltd.
Max Financial Services Ltd., holding a 4.73% weight in the Nifty Midcap150 Momentum 50 Index, reflects a weaker momentum story compared to some of its peers. The company has reported muted performance over the last three years, with profit growth slipping by -57.37% and operating income also contracting by -57.37%. Return ratios remain disappointing, with an ROE of -0.03% and ROCE of 0.00%, indicating limited efficiency in capital deployment. Its profitability has further been under pressure, as reflected in shrinking PAT margins of -7.21%.
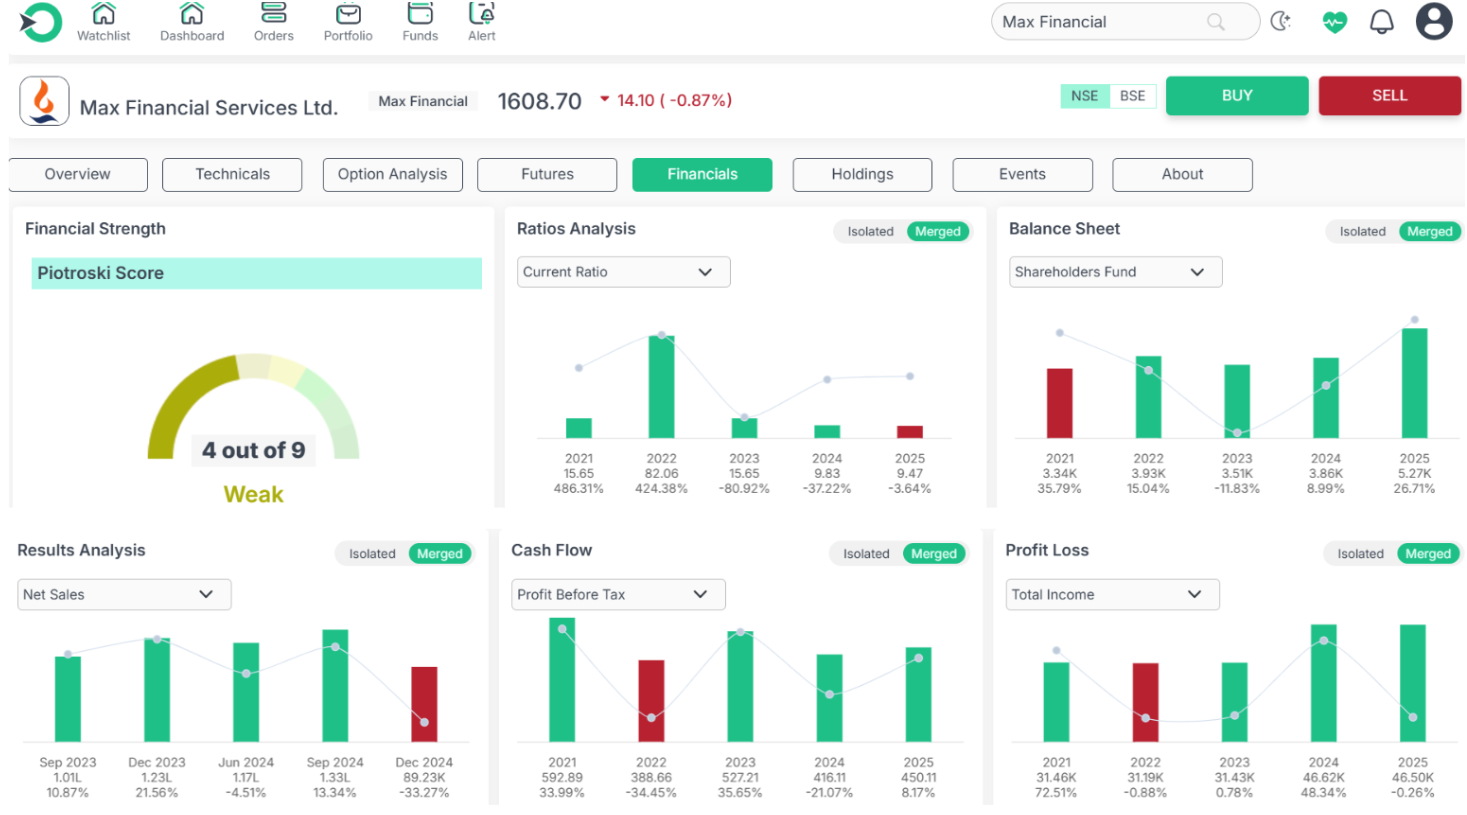
Despite being a significant constituent of the index, Max Financial Services’ weak earnings momentum and deteriorating profitability metrics raise concerns. Unless it can revive growth and improve capital efficiency, its contribution to the Nifty Midcap150 Momentum 50 Index may remain lackluster compared to stronger momentum-driven peers.
-
BSE Ltd.
BSE Ltd., a key constituent of the Nifty Midcap150 Momentum 50 Index, has displayed strong fundamentals over the past three years. The company has delivered robust profitability with an impressive ROA of 16.89%, ROE of 23.52%, and ROCE of 30.37%. Its operating income has expanded at a stellar 3-year CAGR of 60.44%, while profit growth surged by 78.65%, underscoring its operational strength and growth momentum.
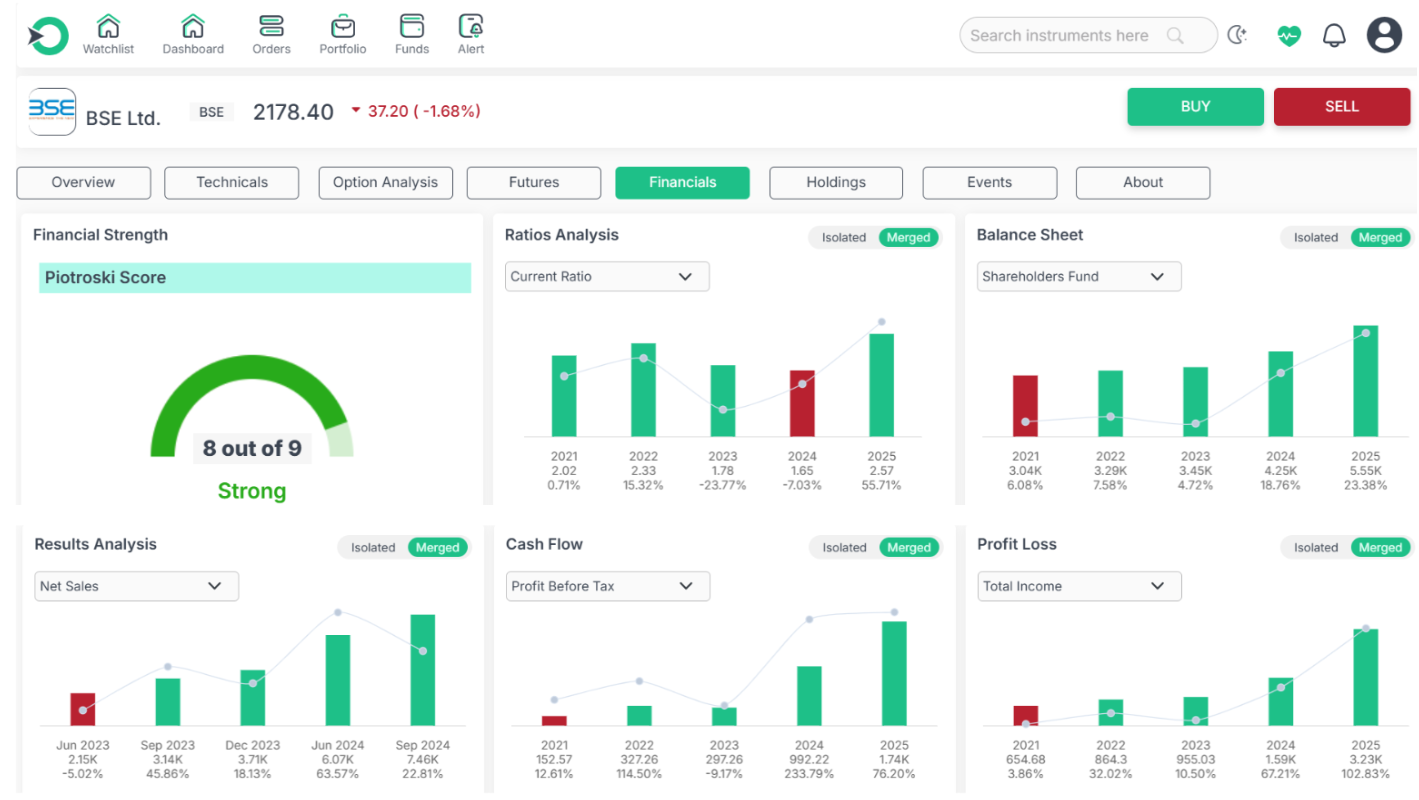
However, there are notable concerns. Promoter shareholding stands at 0%, which may raise questions about management alignment with minority investors. The stock also trades at a steep valuation of 21.07 times its book value, making it relatively expensive. Additionally, profitability pressures are visible with PAT margins shrinking by 21.32%, while provisions and contingencies have spiked sharply by 636.54%, signaling rising risks.
BSE Ltd. adds robust growth potential and healthy capital returns to the Nifty Midcap150 Momentum 50 Index, yet factors like stretched valuations, shrinking margins, and higher provisions suggest a measured outlook is prudent.
-
Suzlon Energy Ltd.
Suzlon Energy’s turnaround in performance has been instrumental in its inclusion within the Nifty Midcap150 Momentum 50 Index. Over the past three years, the company has delivered profit growth of 30.74% and an impressive revenue growth of 45.73%, reflecting renewed investor confidence. A significant debt reduction of Rs. 1,695.82 crore has further strengthened its balance sheet, while a robust ROCE of 37.14% underscores effective capital allocation. Suzlon’s efficient cash conversion cycle of -24.34 days also highlights operational agility that supports its momentum-driven performance.
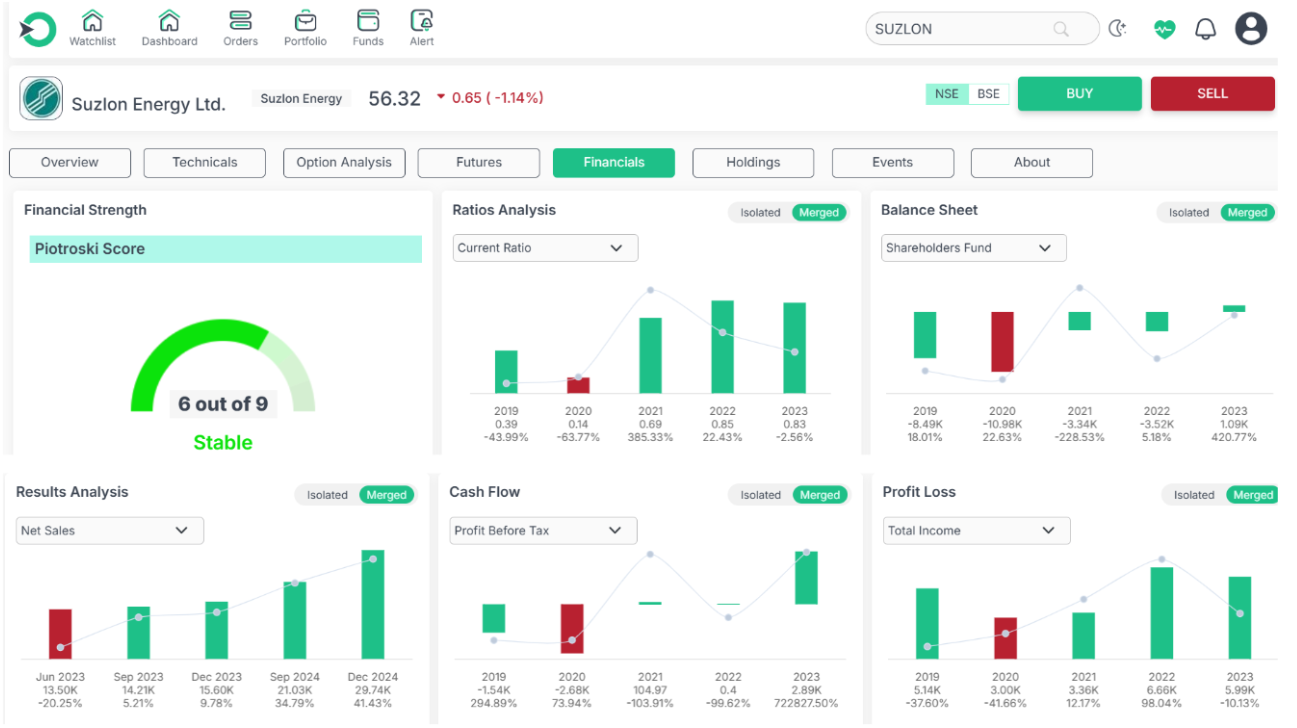
However, the company continues to face certain limitations. Its ROE remains subdued at 1.25%, which limits returns for equity investors. The firm also reported negative operating cash flows of -Rs. 596.19 crore, raising concerns about the sustainability of its growth. Additionally, Suzlon operates with weak profitability margins, as reflected in its five-year average EBITDA margin of -48.04%. While market enthusiasm has lifted valuations, with the stock trading at a PE of 43.24 and EV/EBITDA of 45.97, these rich multiples suggest that much of the momentum may already be priced in.
-
Solar Industries India Ltd.
Solar Industries India Ltd., a constituent of the Nifty Midcap150 Momentum 50 Index, has delivered a strong financial performance in recent years. The company reported a robust profit growth of 45.35% and revenue growth of 20.80% over the past three years. It has also strengthened its balance sheet by reducing debt by Rs. 117.54 crore, while maintaining a virtually debt-free position. Efficiency ratios remain impressive, with a return on equity (ROE) of 29.03% and return on capital employed (ROCE) of 35.15% over the past three years. Its liquidity position is sound, reflected in a current ratio of 2.20 and a healthy interest coverage ratio of 38.24. Operational strength is evident in the company’s 62.68-day cash cycle and CFO-to-PAT ratio of 1.04, underscoring effective cash flow practices. Investor confidence is further anchored by a 73.15% promoter stake.
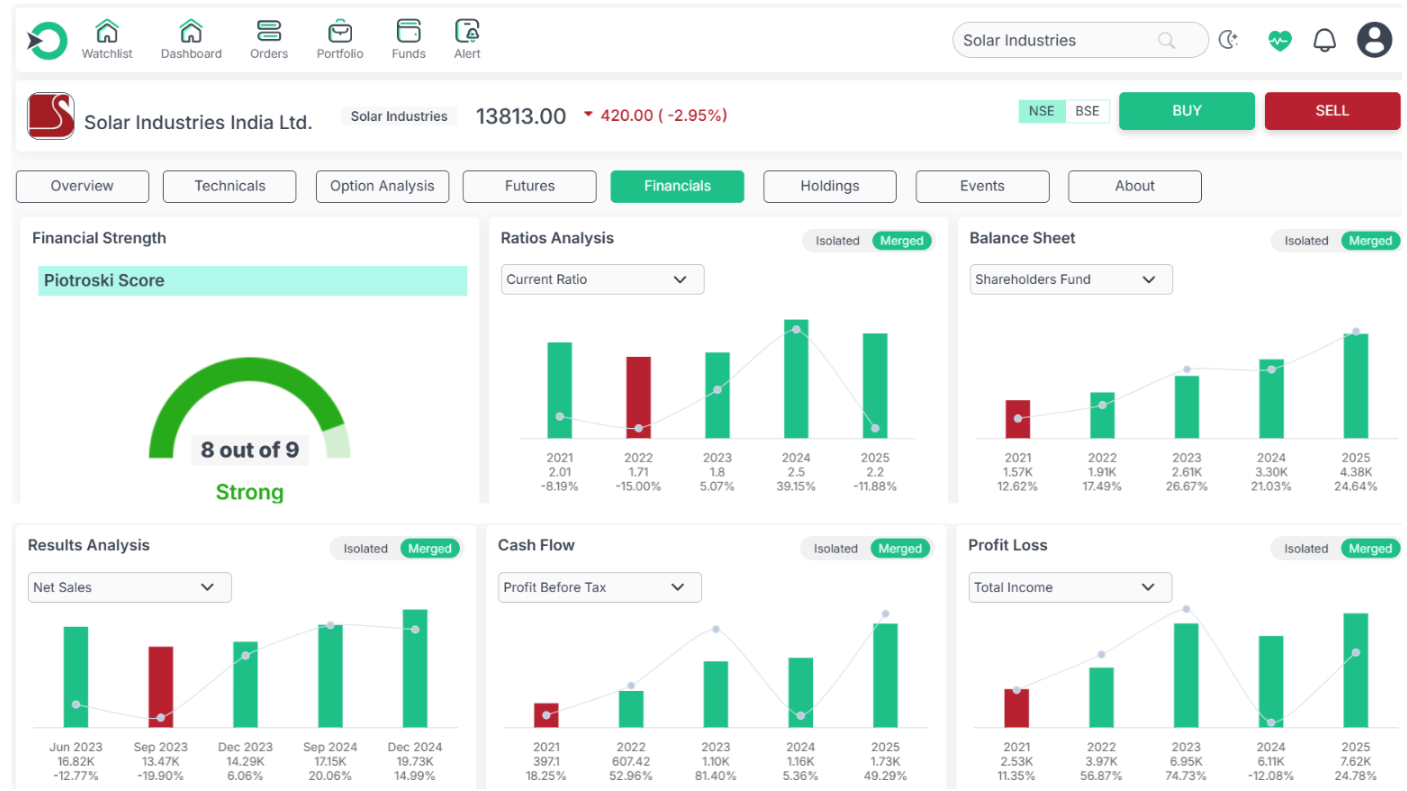
However, certain limitations persist. The company carries contingent liabilities worth Rs. 784.78 crore, which pose a potential risk. Additionally, valuation remains stretched, with a price-to-earnings (PE) ratio of 144.97 and an EV/EBITDA multiple of 98.33, making it an expensive bet for investors despite its strong fundamentals.
Conclusion
The Nifty Midcap150 Momentum 50 Index highlights the most dynamic midcap companies that have consistently delivered strong price momentum backed by operational performance. While top constituents such as Max Healthcare, BSE Ltd., Suzlon Energy, and Solar Industries demonstrate solid growth drivers, challenges like high valuations, weak cash flows, or contingent liabilities cannot be overlooked. For investors, this index serves as both an opportunity to capture high-growth momentum and a reminder of the risks that come with midcap exposure.
Frequently Asked Questions
-
What objective does the Nifty Midcap150 Momentum 50 Index aim to fulfill?
It was designed to help investors track midcap stocks that are showing strong price momentum, making it easier to spot fast-moving companies in one place.
-
How are stocks selected for this index?
Stocks are chosen from the Nifty Midcap 150 list based on their price momentum, adjusted for risk and volatility, ensuring only the most consistent performers make it.
-
Does the index change its stocks often?
No, it is reviewed twice a year, in June and December, so that the portfolio reflects current momentum leaders without excessive churn.
-
What makes this index attractive for investors?
It captures high-growth midcap companies that have been gaining market attention and delivering strong returns, offering exposure beyond large caps.
-
Is investing in this index risk-free?
Not really. While the index focuses on strong performers, midcap stocks can be volatile, and investors should be mindful of valuation risks and market swings.
Disclaimer: This blog is dedicated exclusively for educational purposes. Please note that the securities and investments mentioned here are provided for informative purposes only and should not be construed as recommendations. Kindly ensure thorough research prior to making any investment decisions. Participation in the securities market carries inherent risks, and it's important to carefully review all associated documents before committing to investments. Please be aware that the attainment of investment objectives is not guaranteed. It's important to note that the past performance of securities and instruments does not reliably predict future performance.