Comparing the Top Three Stocks of the Nifty Energy Index
Introduction
The Nifty Energy Index is a sectoral benchmark that tracks the performance of companies operating in India’s petroleum, gas, power, and allied energy businesses. The index was launched in 2005 with a base date of 2001 and has become a crucial measure of India’s energy landscape, balancing traditional fossil fuel companies with players moving toward renewable energy. Among the forty companies included in the index, three—Reliance Industries Ltd., Oil & Natural Gas Corporation Ltd. (ONGC), and Coal India Ltd.—carry the highest weightage and play a decisive role in shaping its performance.
Understanding the Nifty Energy Index
The Nifty Energy Index was created to represent the performance of India’s most significant energy companies. It is calculated using the free-float market capitalization method, which ensures that only shares available for public trading are considered when determining a company’s weightage. This approach makes the index a realistic reflection of the tradable market value of India’s energy sector.
The index comprises 40 companies across the energy value chain, including oil refining, gas distribution, coal production, power generation, transmission and distribution, and related infrastructure. Companies must be part of the Nifty 500, maintain at least 90 percent trading frequency over six months, and have sufficient free-float market capitalization to be eligible. To prevent over-concentration, no single stock can hold more than 33 percent, and the top three combined cannot exceed 62 percent.
Sector Composition (as of August 2025)
This distribution highlights India’s continuing dependence on fossil fuels while also reflecting the increasing importance of power and infrastructure in the energy ecosystem.
|
Sector |
Weight (%) |
|
Oil, Gas & Consumable Fuels |
49.84 |
|
Power |
25.16 |
|
Capital Goods (Energy-linked) |
25 |
Key Constituents by Weightage
|
Company Name |
Weight (%) |
|
Reliance Industries Ltd. |
9.82 |
|
Oil & Natural Gas Corporation Ltd. (ONGC) |
9.79 |
|
Coal India Ltd. |
9.18 |
|
NTPC Ltd. |
6.92 |
|
Suzlon Energy Ltd. |
5.95 |
|
Power Grid Corporation of India Ltd. |
5.56 |
|
GAIL (India) Ltd. |
5.03 |
|
CG Power & Industrial Solutions Ltd. |
3.94 |
|
GE Vernova T&D India Ltd. |
3.05 |
|
Tata Power Co. Ltd. |
2.8 |
Together, these companies represent nearly three-quarters of the index, with Reliance, ONGC, and Coal India leading the pack.
Statistical Overview of the Nifty Energy Index
|
Indicator |
Value (Aug 2025) |
|
Dividend Yield (%) |
2.24 |
|
Price-to-Earnings (P/E) |
14.7 |
|
Price-to-Book (P/B) |
2.33 |
|
Correlation with Nifty 50 |
0.97 |
|
Beta vs Nifty 50 |
1.17 |
|
Annualized Volatility |
~20% |
These figures highlight the index’s strong alignment with the broader market, though its slightly higher beta indicates it is more volatile than the Nifty 50.
Breaking Down the Top Three Constituents of the Nifty Energy Index
-
Reliance Industries Ltd.
Within the framework of the Nifty Energy Index, Reliance Industries brings several strong fundamentals that support its position as the largest constituent. The company maintains an exceptionally efficient cash conversion cycle of -51.23 days, reflecting its ability to generate liquidity faster than peers in the sector. This operational strength is complemented by sound cash flow management, as shown by a CFO to PAT ratio of 1.45, which enhances the stability of returns within the index. Another significant factor is Reliance’s high promoter holding of 50.07 percent, signaling continued confidence from its leadership and lending resilience to the overall index.

At the same time, Reliance also carries certain limitations that influence how the Nifty Energy Index performs. Over the past three years, the company has registered poor profit growth of -2.41 percent and muted revenue growth of just 7.00 percent, both of which weigh on the earnings momentum of the index. Moreover, with the stock trading at a price-to-earnings multiple of 40.38, it remains highly valued, raising concerns about stretched valuations within the sectoral benchmark. These limitations suggest that while Reliance strengthens the index with scale and financial stability, it also introduces valuation and growth-related risks that investors should carefully watch.
-
Oil & Natural Gas Corporation Ltd. (ONGC)
As the second-largest constituent of the Nifty Energy Index, Oil & Natural Gas Corporation (ONGC) adds significant stability to the sectoral benchmark through its strong financial position and operational efficiency. The company is virtually debt free, which reduces financial risk and allows it to navigate the cyclical nature of crude oil markets more effectively. ONGC also maintains a healthy interest coverage ratio of 11.16, demonstrating its ability to comfortably meet debt obligations. Over the last five years, the company has sustained average operating margins of 32.55 percent, underscoring its strong cost management and profitability in the upstream energy business. Its efficient cash conversion cycle of -2,812.16 days further reflects the robustness of its operations, supported by solid cash flow management, with a CFO to PAT ratio of 1.77. In addition, the company’s high promoter holding of 58.89 percent conveys strong backing from stakeholders, lending further confidence to its role in the index.
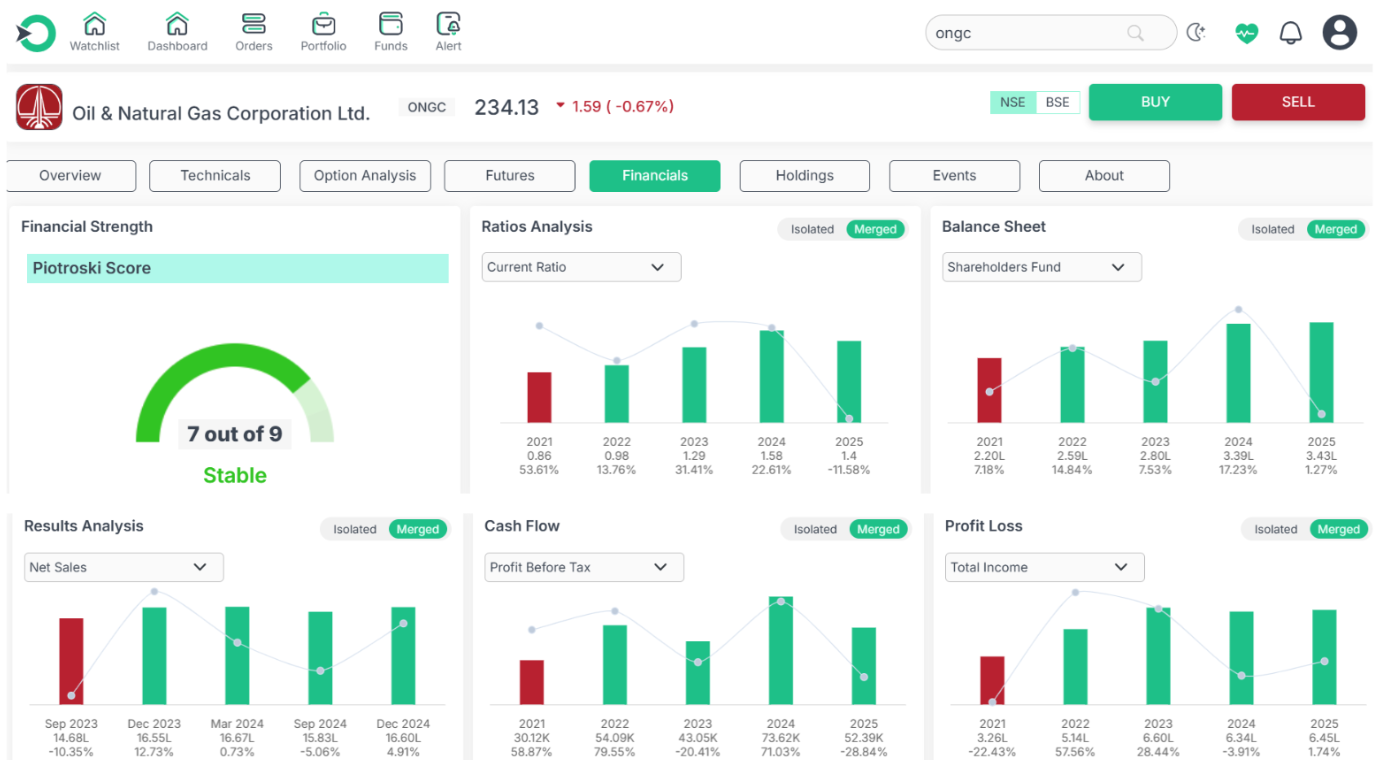
Despite these strengths, ONGC also has limitations that temper its contribution to the Nifty Energy Index. Over the past three years, the company has delivered a poor profit growth of -4.04 percent, suggesting earnings pressure in a volatile global energy environment. Its revenue growth of 6.66 percent over the same period has also been modest, indicating challenges in expanding its topline despite favorable crude cycles. These constraints mean that while ONGC anchors the index with financial resilience and operational efficiency, its muted growth trajectory poses a drag on the overall momentum of the benchmark.
-
Coal India Ltd.
Coal India Ltd., the third-largest constituent of the Nifty Energy Index, contributes significant strength to the benchmark through its dominant position in the coal sector and consistently strong financial performance. The company has maintained an exceptionally high return on equity (ROE) of 92.78 percent and a return on capital employed (ROCE) of 94.07 percent over the past three years, reflecting extraordinary efficiency in generating returns from its resources. It is virtually debt free, which enhances financial stability, and its interest coverage ratio of 4,621.95 highlights an unmatched ability to meet financial obligations with ease. Operationally, Coal India has delivered an average operating margin of 25.95 percent over the last five years, while maintaining an efficient cash conversion cycle of -1,222.01 days. Its current ratio of 6.15 further underscores a strong liquidity position, and a promoter holding of 63.13 percent reflects firm backing from stakeholders. These attributes make Coal India a highly reliable player within the index, ensuring steady support for the benchmark’s performance.
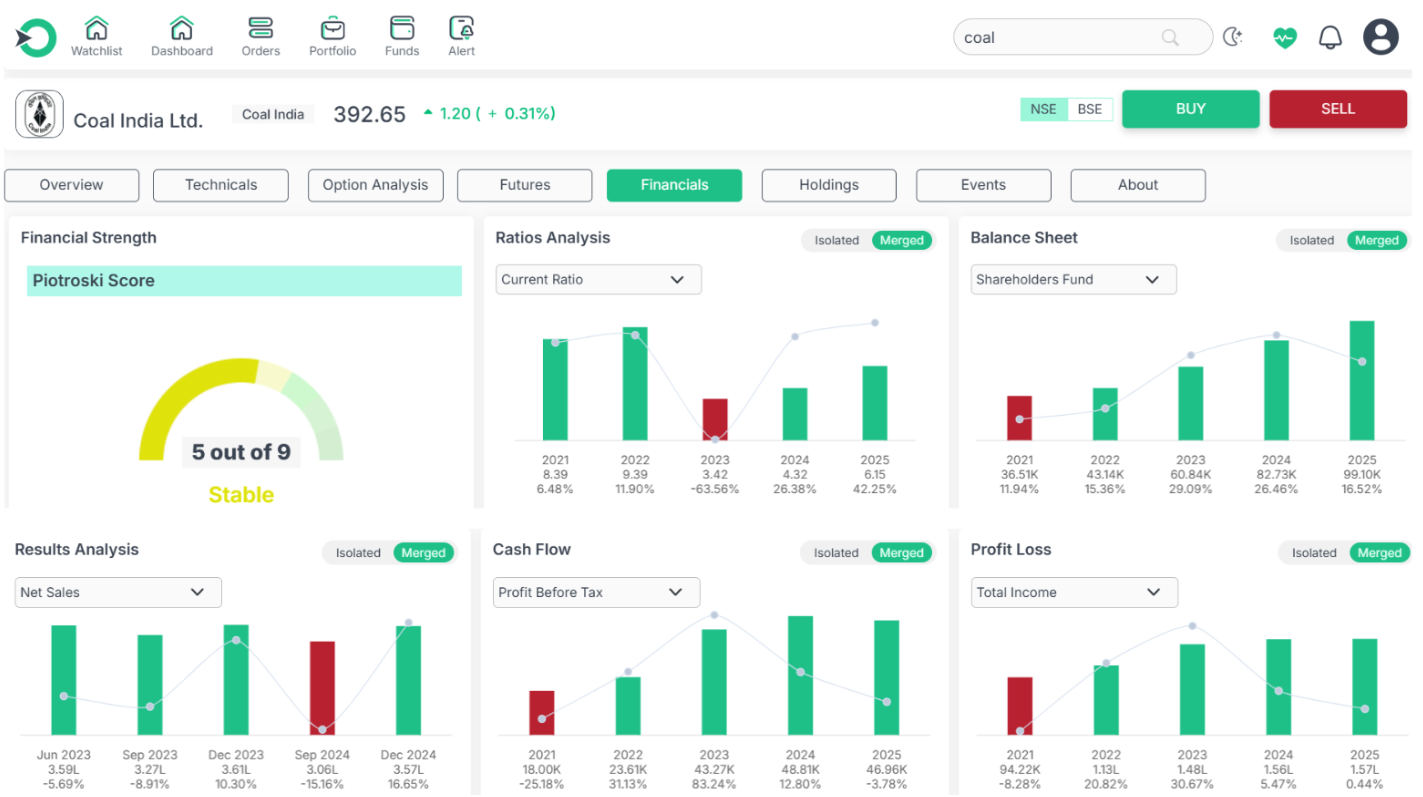
On the other hand, Coal India does face certain limitations that moderate its contribution to the Nifty Energy Index. Over the past three years, the company has delivered revenue growth of only 11.48 percent, which, while positive, is relatively subdued compared to its scale of operations. Additionally, its tax rate remains unusually low at 0.47 percent, which may not be sustainable in the long term and could affect reported earnings if normalized. These limitations suggest that while Coal India enhances the index with stability, liquidity, and operational efficiency, its modest growth trajectory and potential tax-related adjustments are important factors for investors to keep in mind.
Conclusion
The Nifty Energy Index provides a comprehensive snapshot of India’s energy sector, balancing the influence of giants like Reliance, ONGC, and Coal India. Each of these companies brings unique strengths that reinforce the index, while also carrying certain limitations that shape its overall performance. Rather than favoring one company over another, it is important to view them collectively as key contributors to India’s energy economy and the index’s stability. For investors, the Nifty Energy Index serves as both a benchmark and a reflection of the evolving balance between traditional energy sources and emerging sustainable alternatives.
Start your investment journey with confidence on the Enrich Money trading platform, designed to help you explore opportunities in indices like Nifty Energy with ease.
Frequently Asked Questions
-
What is the Nifty Energy Index?
The Nifty Energy Index is a sector-based index designed to measure the performance of major Indian companies engaged in petroleum, gas, coal, and power businesses.
-
How many companies are part of the Nifty Energy Index?
This index consists of 40 listed companies that collectively cover different segments of the energy sector.
-
Which are the leading companies in the Nifty Energy Index?
Reliance Industries, ONGC, and Coal India are the top three companies with the highest weightage in the index.
-
How is the Nifty Energy Index determined?
The index is calculated using the free-float market capitalization method, which factors in only the shares actively available for public trading.
-
Why does the Nifty Energy Index matter to investors?
It serves as a key tool for investors to evaluate the overall energy sector’s performance, compare portfolios, and invest in both conventional and new-age energy firms.
Disclaimer: This blog is dedicated exclusively for educational purposes. Please note that the securities and investments mentioned here are provided for informative purposes only and should not be construed as recommendations. Kindly ensure thorough research prior to making any investment decisions. Participation in the securities market carries inherent risks, and it's important to carefully review all associated documents before committing to investments. Please be aware that the attainment of investment objectives is not guaranteed. It's important to note that the past performance of securities and instruments does not reliably predict future performance.