Investing in Defence: Comparing Stocks in the Nifty India Defence Index

Indian Defence Sector
The Indian defence sector is the fourth largest sector budget wise with investment of USD 72.6 billion . Indian defence is the second largest armed force in the world with 1.45 million active personnel. India's defence expenditure is 3.7 % of the total global military expenditure. India's defence has grown ten times over the last 10 years.
Key Demand drivers for Indian Defence industry
-
GoI has planned to invest around USD 130 billion for fleet modernizations.
-
India has engaged around 164 technologies, 2002 experts and 5399 companies in defence manufacturing with a sanctioning fund of around USD 30 million.
-
India has developed highly complex systems, sensors , weapons and ammunition of over 509.
-
The Indian defence industry has designed fighter aircrafts under Make in India initiative.
-
India has planned to acquire 1580 artillery guns, 814 mounted gun systems, 100 tracked artillery guns
-
The Indian Navy has planned to procure 12 mine countermeasure vessels.
-
Under the strategic partnership model , India has planned to acquire 1700 future ready combat vehicles for the Indian army.
Indian Defence Private Sector Undertakings include companies like MKU, Ashok Leyland, Mahindra, Tata Advanced Systems, L&T, Reliance Defence and Engineering Limited, Godrej Aerospace, Kirloskar Limited, Punj Lloyd, Adani Defence & Aerospace, Dynamatic Technologies and Kalyani Group.
Indian Defence Public Sector Undertakings include companies like BEML Ltd, Goa Shipyard Ltd, Hindustan Aeronautics Ltd, Bharat Electronics Ltd, Bharat Dynamics Ltd, Mishra Dhatu Nigam Ltd, Defence Engineering & Development Organization, Garden reach shipbuilders AND engineering Ltd, Advanced Weapons and Equipment India Limited, Mazagon Dock Shipbuilders Ltd, Hindustan Shipyard Ltd, Gliders India Limited, Troop Comforts Limited, Munitions India Limited, Armoured Vehicles Nigam Limited, Troop Comforts Limited, Yantra India Limited and India Optel Limited.
Key Players In Indian Defence Sector
-
Hindustan Aeronautics Limited
-
Bharat Electronics Limited
-
BEML Limited
-
MIDHANI
-
Mazagon Dock Shipbuilders Limited
-
Goa Shipyard Limited
-
Hindustan Shipyard Limited
-
Bharat Dynamics Limited
-
Garden Reach Shipbuilders and Engineers Limited
-
Defence Research and Development Organization
Nifty India Defence Stocks
Nifty India Defence index is a part of Nifty's Equity Thematic index. This Nifty India Defence index helps to monitor the defence stock performance. The weightage for the Nifty India Defence stock index is on the basis of free float market capitalization method with defence stock weightage of 20% on its market capitalization. Nifty India Defence stock index was launched on 19th January, 2022 with base date as 2nd April, 2018 with a base number of 1000. The index can include stocks of around 10 to 30. Currently, the index constituents are 15 in number. The index constituents are reconstituted on semi-annual basis side by side with Nifty Broad-based indices. Nifty India Defence index can be utilized for benchmarking, launching of index funds, Equity Traded Funds and for products that are structural.
Eligibility of Nifty India Defence Index
-
This Nifty India Defence index includes stocks of companies which generate revenue around 10% from the defence industry and on an average six-month free float market capitalization basis.
-
The stocks which are included in Nifty Total Market are considered for Nifty India Defence index at time of review.
-
Companies that belong to the category of basic industries or part of SIFM with 10% revenue through defence are included under Nifty India Defence index.
|
Company Name |
Industry |
Weightage |
|
Hindustan Aeronautics Ltd. |
Capital Goods |
21.69% |
|
Bharat Electronics Ltd. |
Capital Goods |
20.72% |
|
Solar Industries India Ltd. |
Chemicals |
13.90% |
|
Bharat Dynamics Ltd. |
Capital Goods |
9.16% |
|
Cochin Shipyard Ltd. |
Capital Goods |
8.87% |
|
Mazagoan Dock Shipbuilders Ltd. |
Capital Goods |
6.18% |
|
Astra Microwave Products Ltd. |
Capital Goods |
4.69% |
|
Data Patterns (India) Ltd. |
Capital Goods |
4.57% |
|
Garden Reach Shipbuilders & Engineers Ltd. |
Capital Goods |
2.62% |
|
MTAR Technologies Ltd. |
Capital Goods |
2.24% |
|
DCX Systems Ltd. |
Capital Goods |
|
|
Ideaforge Technology Ltd. |
Capital Goods |
|
|
Mishra Dhatu Nigam Ltd. |
Capital Goods |
|
|
Paras Defence and Space Technologies Ltd. |
Capital Goods |
|
|
Zen Technologies Ltd. |
Capital Goods |
|
Performance Comparison of Nifty India Defence Sector Index
Nifty India Defence index stocks have delivered a total return of 177.67% for a period of 1 year. The price return for a period of 1 year is 175.57%. The total price return on quarter to date was 43.30% and year to date was 59.67%
Historical Price Analysis of Nifty India Defence Index
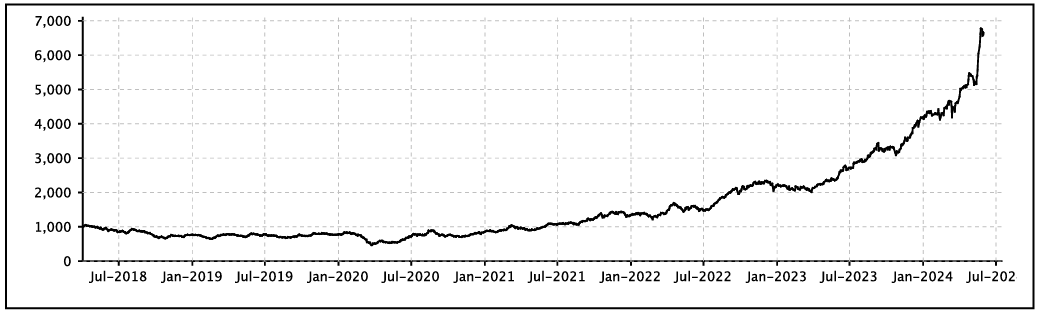
The price to equity ratio is 58.72 and price to book ratio is 15.58. The Nifty India Defence index has delivered a dividend yield of 0.44%.
Nifty India Defence Index Stock Comparison
To analyze the Nifty India Defence index stocks, let’s consider three of the Nifty India Defence Index stocks for comparative analysis.
Discover Enrich Money's digital investing platform and take your financial future into your own hands. Sign up for a free demat trading account today with Enrich Money, your trusted partner in wealth tech management.
Let’s consider the below stocks for comparative analysis.
Intraday Price Comparative Analysis
|
Stock Name (as of 21st June, 2024) |
Hindustan Aeronautics Limited |
Bharat Electronics Limited |
Solar Industries India Limited |
|
Open (INR) |
Rs.5296 |
Rs.309.95 |
Rs.9819.95 |
|
High (INR) |
Rs.5687.60 |
Rs.320 |
Rs.9874.55 |
|
Low (INR) |
Rs.5217.80 |
Rs.297 |
Rs.9787.55 |
|
Last Traded Price (INR) |
Rs.5373.35 |
Rs.315.20 |
Rs.9828.20 |
|
Price Change (%) |
3.92% |
3.36% |
-2.08% |
|
Volume |
804080 |
4567055 |
11952 |
|
Previous Close (INR) |
Rs.5170.55 |
Rs.304.95 |
Rs.10036.95 |
On basis of intraday price analysis, the stock price of Hindustan Aeronautics Limited and Bharat Electronics Limited are in uptrend.
Monthly Price Comparative Analysis
|
Stock Name |
Hindustan Aeronautics Limited |
Bharat Electronics Limited |
Solar Industries India Limited |
|
Date |
Closing Price in INR |
||
|
Jun 21, 2024 |
5,170.55 |
304.95 |
10,036.95 |
|
Jun 1, 2024 |
5,170.55 |
304.95 |
10,036.95 |
|
May 1, 2024 |
4,973.85 |
295.95 |
9,370.50 |
|
Apr 1, 2024 |
3,939.35 |
233.75 |
8,968.15 |
|
Mar 1, 2024 |
3,327.00 |
201.5 |
8,781.75 |
|
Feb 1, 2024 |
3,084.05 |
205.1 |
6,730.25 |
|
Jan 1, 2024 |
2,999.40 |
185.9 |
6,457.35 |
|
Dec 1, 2023 |
2,804.00 |
184.2 |
6,727.50 |
|
Nov 1, 2023 |
2,379.80 |
145.9 |
6,288.90 |
|
Oct 1, 2023 |
1,823.05 |
133.25 |
5,500.50 |
|
Sep 1, 2023 |
1,928.15 |
138.3 |
4,820.00 |
|
Aug 1, 2023 |
1,950.15 |
133.2 |
4,838.30 |
|
Jul 1, 2023 |
1,980.75 |
130.7 |
3,800.55 |
While observing the monthly stock price data, the stock price of all the three defence stocks is in tremendous uptrend.
Chart Analysis
Hindustan Aeronautics Limited
Hindustan Aeronautics Limited, operating in the business of aerospace and defence . Hindustan Aeronautics Limited, operates from Bengaluru, Karnataka as its headquarters. The company incorporated in 1940, is one the important entities in the Indian Defence industry. Hindustan Aeronautics Limited collaborates with international aerospace entities for technological ventures.
The Bearish Heikin Ashi pattern with bearish tick from red to green is formed on daily charts. The Bullish Initiation Heikin Ashi pattern is formed on weekly charts. Bullish Continuation Heikin Ashi pattern with high volume is observed on monthly price data.
Bharat Electronics Limited
Bharat Electronics Limited, operates in the business of manufacturing of aerospace and defence electronics. Incorporated in 1954 by the Defence Ministry, GoI. The entity produces various defence products for the Indian Army. The company also develops in-house technologies under Make In India initiatives.
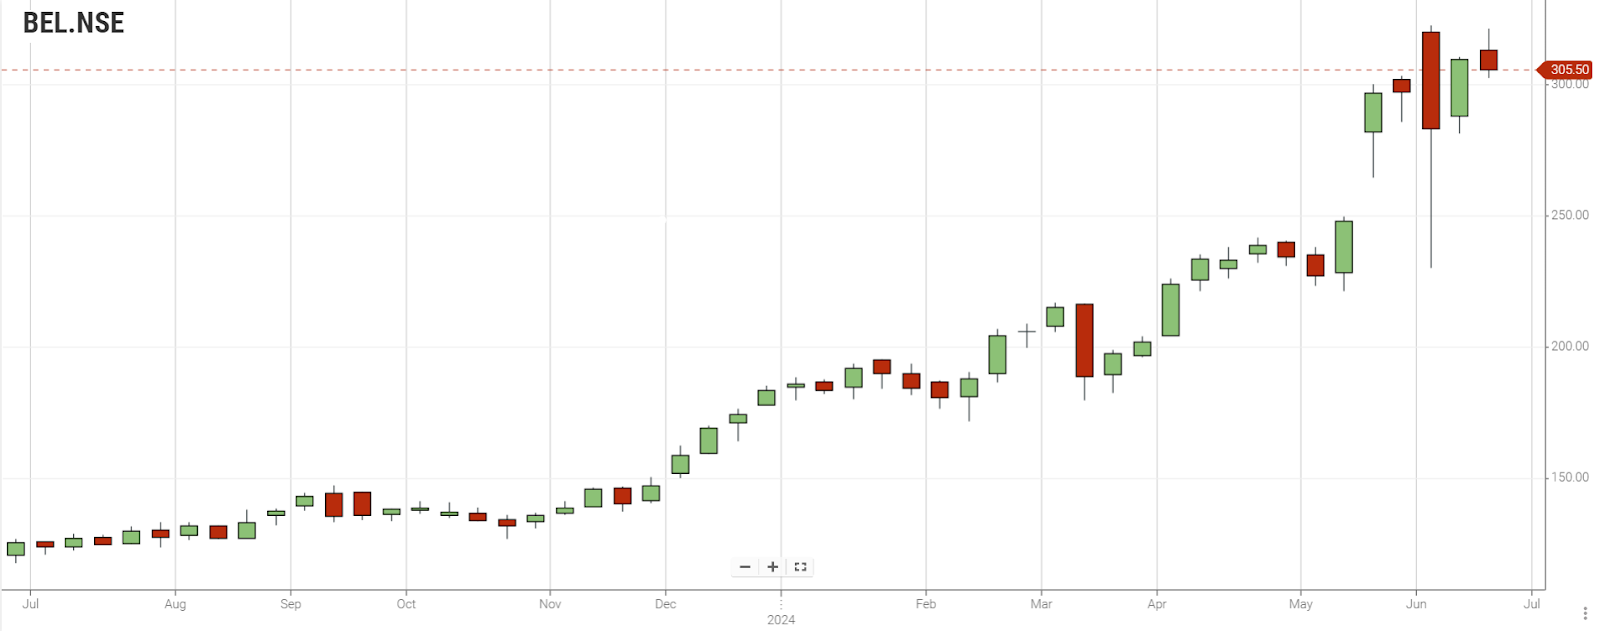
The Spinning Top Heikin Ashi pattern is formed with neutral signals on daily charts. The Bullish Initiation Heikin Ashi pattern is formed on weekly charts. Bullish Heikin Ashi pattern is observed with high volume on monthly price data.
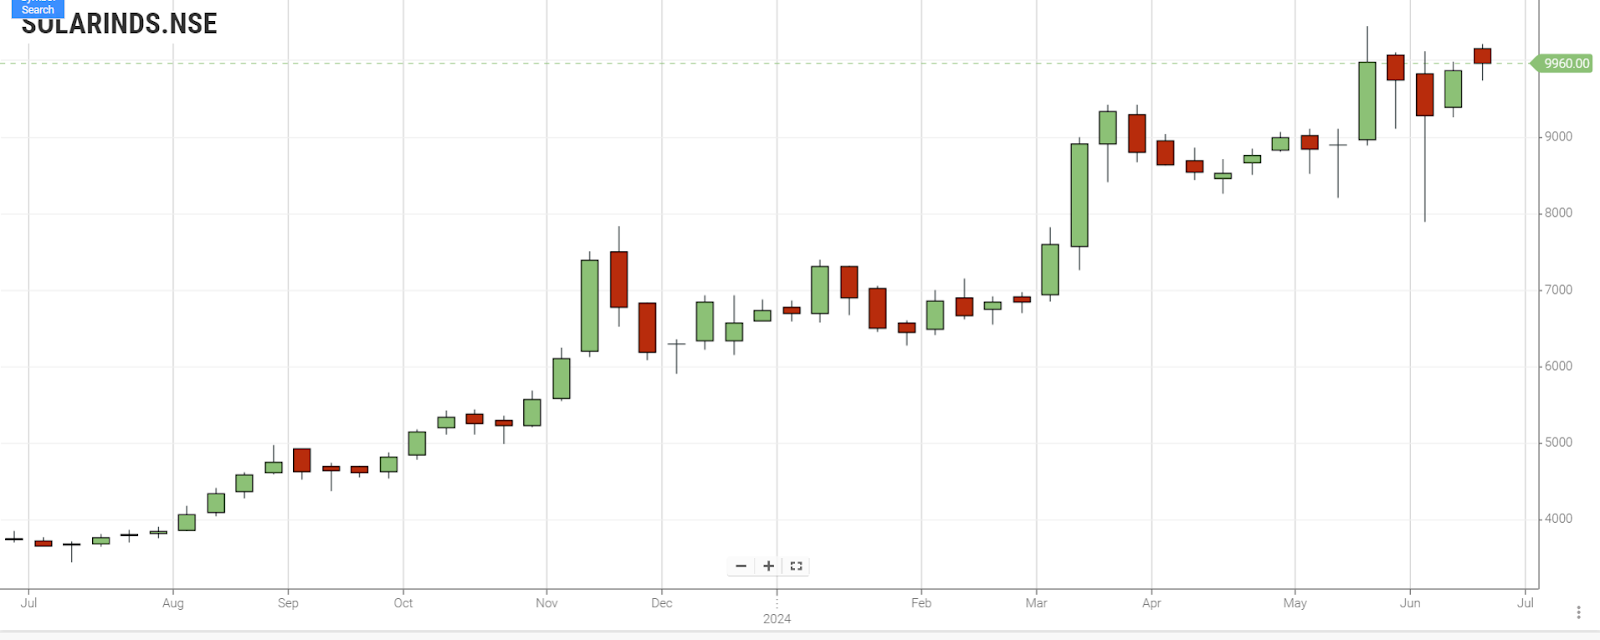
Solar Industries India Limited
Solar Industries Limited, operates in the business of manufacture of explosives for industrial needs. Incorporated in 1995, with its presence in over 50 countries specialized in the defence sector. Solar industries are concentrating on going green energy with sustainable development.
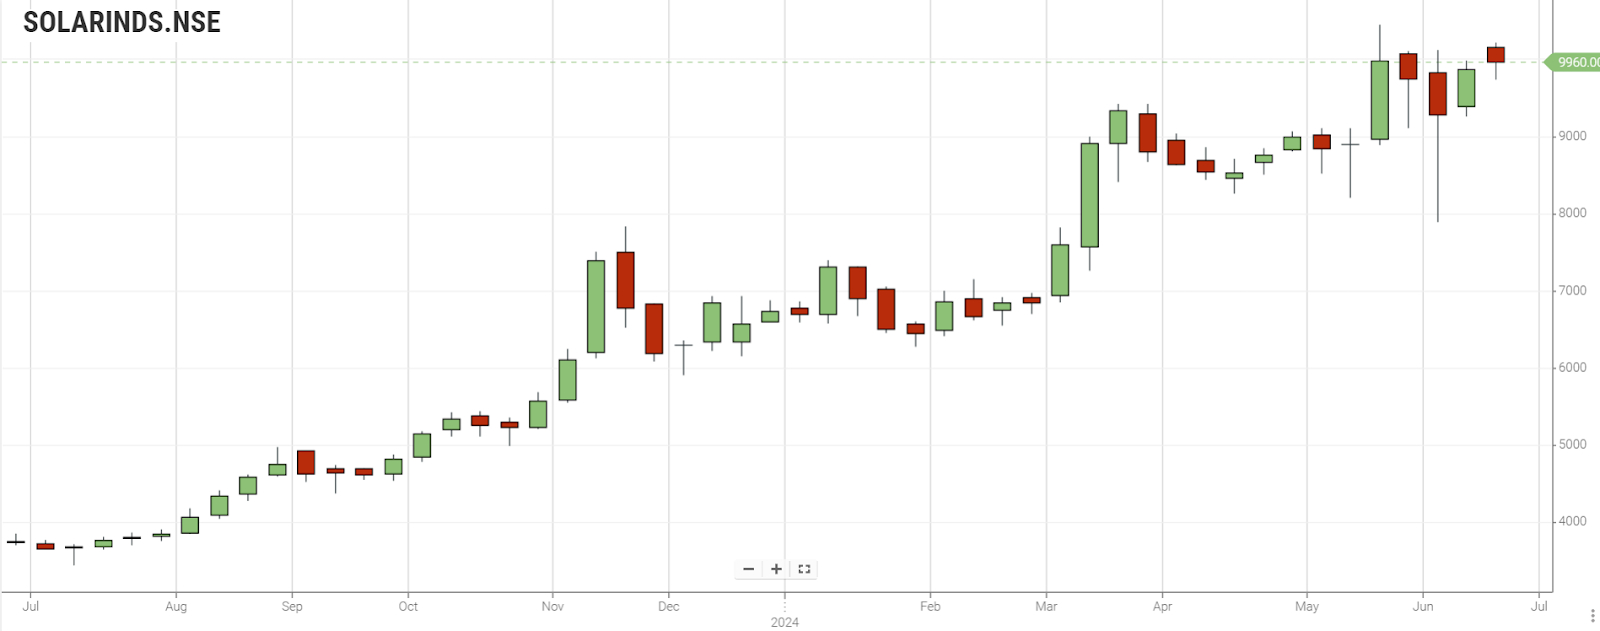
The Spinning Top Continuation Heikin Ashi pattern is formed on daily charts. The Bullish Initiation Heikin Ashi pattern is formed on weekly charts. Bullish Continuation Heikin Ashi pattern with high volume is observed on monthly price data.
Fundamental Analysis
|
Stock Name |
Hindustan Aeronautics Limited |
Bharat Electronics Limited |
Solar Industries India Limited |
|
Market Cap (in INR Crores) |
353604.76 |
228101.64 |
88629.58 |
|
Dividend Yield % |
0.42% |
0.71% |
0.09% |
|
TTM EPS (in INR Crores) |
113.96 |
5.45 |
92.38 |
|
TTM PE |
46.4 |
57.25 |
106.03 |
|
P/B |
3.87 |
12.25 |
8.41 |
|
ROE |
27.18 |
23.52 |
25.51 |
Hindustan Aeronautics Limited
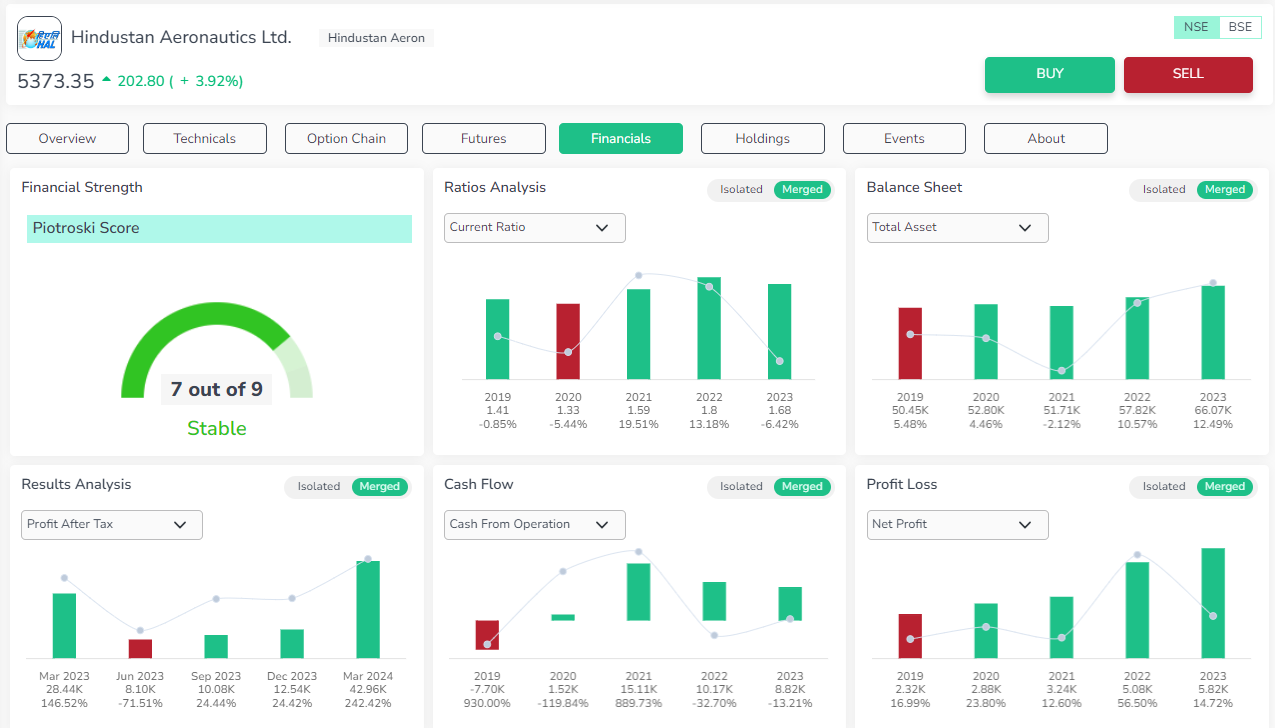
Valuation – Book value of the stock has increase in the past three years. But the P/B ratio indicates that the stock is overpriced. The shareholder’s value is very low.
Profitability – Profitability scores are good with excellent increase in net profit, net margin, ROE , EPS , RoCE, earnings, EBITDA and growth . But the stock has delivered poor dividend and earnings yield.
Growth – The stock has delivered positive numbers in annual sales, quarterly sales and total assets over a period of the last three years. But the operating cash flow is on a negative trend for the last three years.
Stability - The stock has excellent stability. The company has settled over 50% of its debt and is proceeding every year towards getting debt free and increase in revenue.
Bharat Electronics Limited
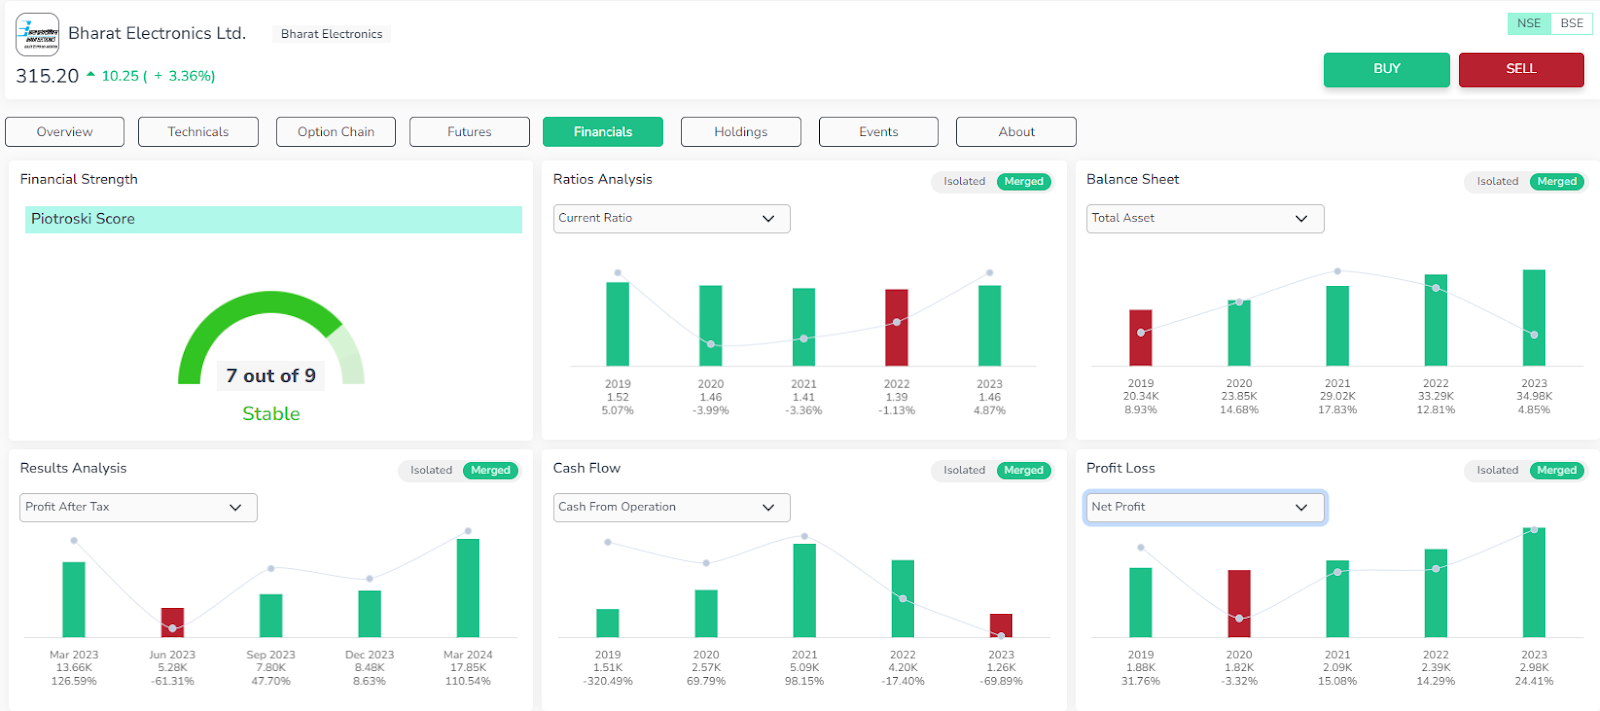
Valuation – The shareholders return, P/B ratio and price to earnings ratio indicate that the stocks are highly overpriced .
Profitability – The stocks have positive net profit, EPS growth, company’s earnings, RoE, RoCE, PBT , EBITDA. But the stock has delivered a very low dividend.
Growth – The sale of the company over a period of last three years is in uptrend. But the operating cash flow is in downtrend.
Stability - The stock has excellent stability. Company’s liquidity has improved.
Solar Industries India Limited
Valuation – The book value of the stock is excellent. But the shareholders return value, P/B ratio are poor with stock being overpriced.
Profitability – The stock has positive returns in terms of net profit, RoE, RoCE, earnings, EPS, EBITDA, net margin over the past five quarters. But the stock dividend yield is very low.
Growth – The company’s total asset value has been uptrend in the last three years.
Stability - The stock has good stability and debt free. Company’s liquidity has improved.
Technical Analysis
Unlock comprehensive insights into stock performance with the Orca app. Get detailed technical and fundamental analysis at your fingertips. Download now!
|
Technical Analysis @ 21.06.2024 |
|||
|
Stock Name |
Hindustan Aeronautics Limited |
Bharat Electronics Limited |
Solar Industries India Limited |
|
Moving Averages |
|||
|
SMA 20 Days |
3894.7 |
232.98 |
8734.22 |
|
EMA 20 Days |
3870 |
229.95 |
8685.5 |
|
SMA 200 Days |
2659.77 |
170.77 |
6419.63 |
|
EMA 200 Days |
2805.98 |
177.49 |
6419.63 |
|
Indicators |
|||
|
RSI |
69.12 |
56.72 |
40.15 |
|
CCI |
168.13 |
-16.42 |
-171.19 |
|
WILLIAMS_R |
-11.99 |
-43.81 |
-93.86 |
|
UO |
62.11 |
50.22 |
36.33 |
|
Rate of Change |
6.08 |
-0.81 |
-6.06 |
|
MACD |
124.25 |
2.32 |
31.75 |
|
ADX |
0 |
0 |
0 |
|
Standard Pivot Levels |
|||
|
R4 |
4205.9 |
234.45 |
8445.7 |
|
R3 |
4201.32 |
234.05 |
8420.02 |
|
R2 |
4196.73 |
233.65 |
8394.33 |
|
R1 |
4190.87 |
233.45 |
8372.17 |
|
Pivot |
4186.28 |
233.05 |
8346.48 |
|
S1 |
4180.42 |
232.85 |
8324.32 |
|
S2 |
-4187.57 |
-232.85 |
-8342.97 |
|
S3 |
4169.97 |
232.25 |
8276.47 |
|
S4 |
4164.1 |
232.05 |
8254.3 |
Hindustan Aeronautics Limited
SMA and EMA levels indicate that stock exhibits strong bearish signals. The technical indicators imply that the stocks would be bearish to bullish.
Bharat Electronics Limited
SMA and EMA levels indicate that stock exhibits strong bearish signals. The technical indicators imply that the stocks would be neutral.
Solar Industries India Limited
SMA and EMA levels indicate that stock exhibits bullish signals. The technical indicators imply that the stocks would follow a neutral pattern.
The below chart exhibits the comparative technical study of three Nifty India Defence Index stocks based on Moving average crossover signals and Relative strength index for a period of 6 months.
Conclusion
Investing in the Nifty India Defence Index exposes investors to India's rapidly growing defence sector, driven by government investments and modernization initiatives. With a budget of USD 72.6 billion, India's defence sector is the fourth largest globally and continues to expand, leveraging advanced technologies and partnerships. The Nifty India Defence Index, launched in 2022, tracks the performance of key defence stocks, including Hindustan Aeronautics Limited, Bharat Electronics Limited, and Solar Industries India Limited. These companies have shown impressive returns, reflecting strong growth and stability, despite varied valuations and dividend yields. Investors can consider these factors when evaluating potential investments in the sector.
Enrich Money’s Orca app offers investors detailed insights into stock momentum trends. It is recommended that investors conduct comprehensive assessments using both technical and fundamental analysis tools before making any investment decisions.
Frequently Asked Questions
What is the Nifty India Defence Index?
The Nifty India Defence Index is a thematic equity index launched by NSE on 19th January, 2022. It is used to track the performance of companies in the Indian defence sector. The index uses the free float market capitalization method for weightage.
Which companies are included in the Nifty India Defence Index?
The index comprises 15 companies that generate at least 10% of their revenue from the defence industry. Notable constituents include Hindustan Aeronautics Limited, Bharat Electronics Limited, and Solar Industries India Limited. The list is reviewed semi-annually.
How is the Nifty India Defence Index calculated?
The index is calculated based on the free float market capitalization method. Each stock's weight is based on its market cap, with a cap of 20%. The index is reviewed semi-annually to ensure it reflects current market conditions.
What are the benefits of investing in the Nifty India Defence Index?
Investing in the index provides exposure to India's growing defence sector, driven by substantial government investment. It offers diversified risk across multiple companies. The index has shown strong returns, making it an attractive investment option.
How can I invest in the Nifty India Defence Index?
You can invest through index funds or ETFs that track the Nifty India Defence Index. These funds are available through a reliable brokerage platform ‘ Enrich Money’. Consult with a financial advisor with Enrich Money to determine the best investment strategy for your portfolio.