Power Sector ' Q1 FY26 Earnings: Adani Green vs. Tata Power

India's power market is undergoing a quick change, led by mounting energy requirements, unwavering innovation, and an aggressive shift to renewable sources. In this industry, Adani Green Energy and Tata Power are leaders not just because of their size but also because of the unique approaches they adopt to boost innovation and growth. Wrapping up the first quarter of FY26, the two companies have again set the tone for the sector, announcing earnings that map out the prospects and challenges in the country's evolving energy economy. This report summarizes the major takeaways from their Q1 FY26 performance, revealing how each company is transforming India's energy sector in the here and now as well as in the future.
Industry Overview: India's Power Sector and FY26 Outlook
India's power sector is among the most strategically crucial and dynamically changing industries, the backbone of the country's economic growth and urbanization.
Key Trends Driving Q1 FY26
Renewable Energy Growth: Solar and wind capacity additions continue on a fast track, with the government aiming for 500 GW of non-fossil fuel energy by 2030.
Policy & Regulatory Push: Positive reforms, better grid access, and focused funding to clean energy are opening up new investments and project pipelines.
Technology: The introduction of smart grids, AI-based operations, and digital service platforms is improving the efficiency of generation, transmission, and consumption of power.
Changing demand dynamics: While traditional power demand persists, renewable energy adoption—especially by industrial and commercial consumers—is increasing at a higher rate.
Competitive Landscape
Industry champions like Adani Green Energy and Tata Power are leading this shift. Adani Green is aggressively building its renewable capacity, creating milestones in green energy expansion, while Tata Power rides on its diversified portfolio and operational capabilities to ensure resilience and wide market presence.
Key Challenges Ahead
Grid Integration: The steep increase in renewable capacity requires smarter infrastructure and more advanced systems to handle intermittency.
Financial Risks: Even with improving profitability, issues such as high debt, volatile input prices, and uncertainty about tariffs still exist.
Regulatory Consistency: Stable and favorable policy conditions are important to ensure long-term investment and maintain sectoral growth.
Company Overview
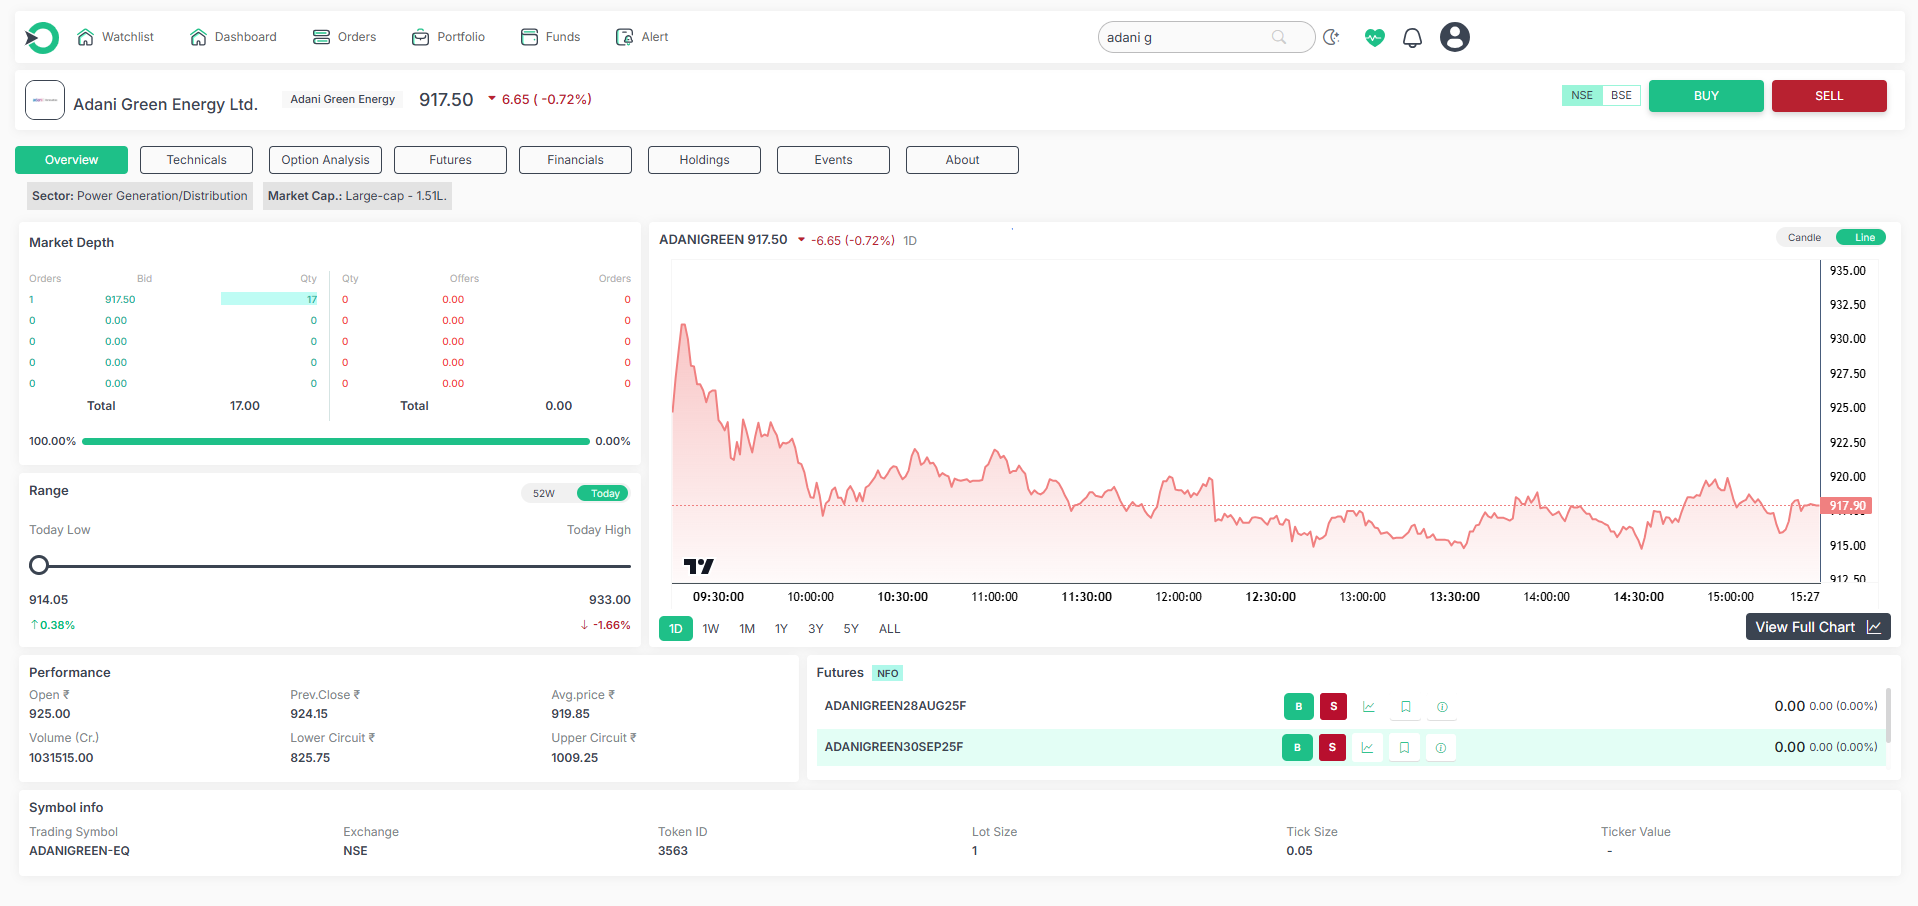
Adani Green Energy Limited
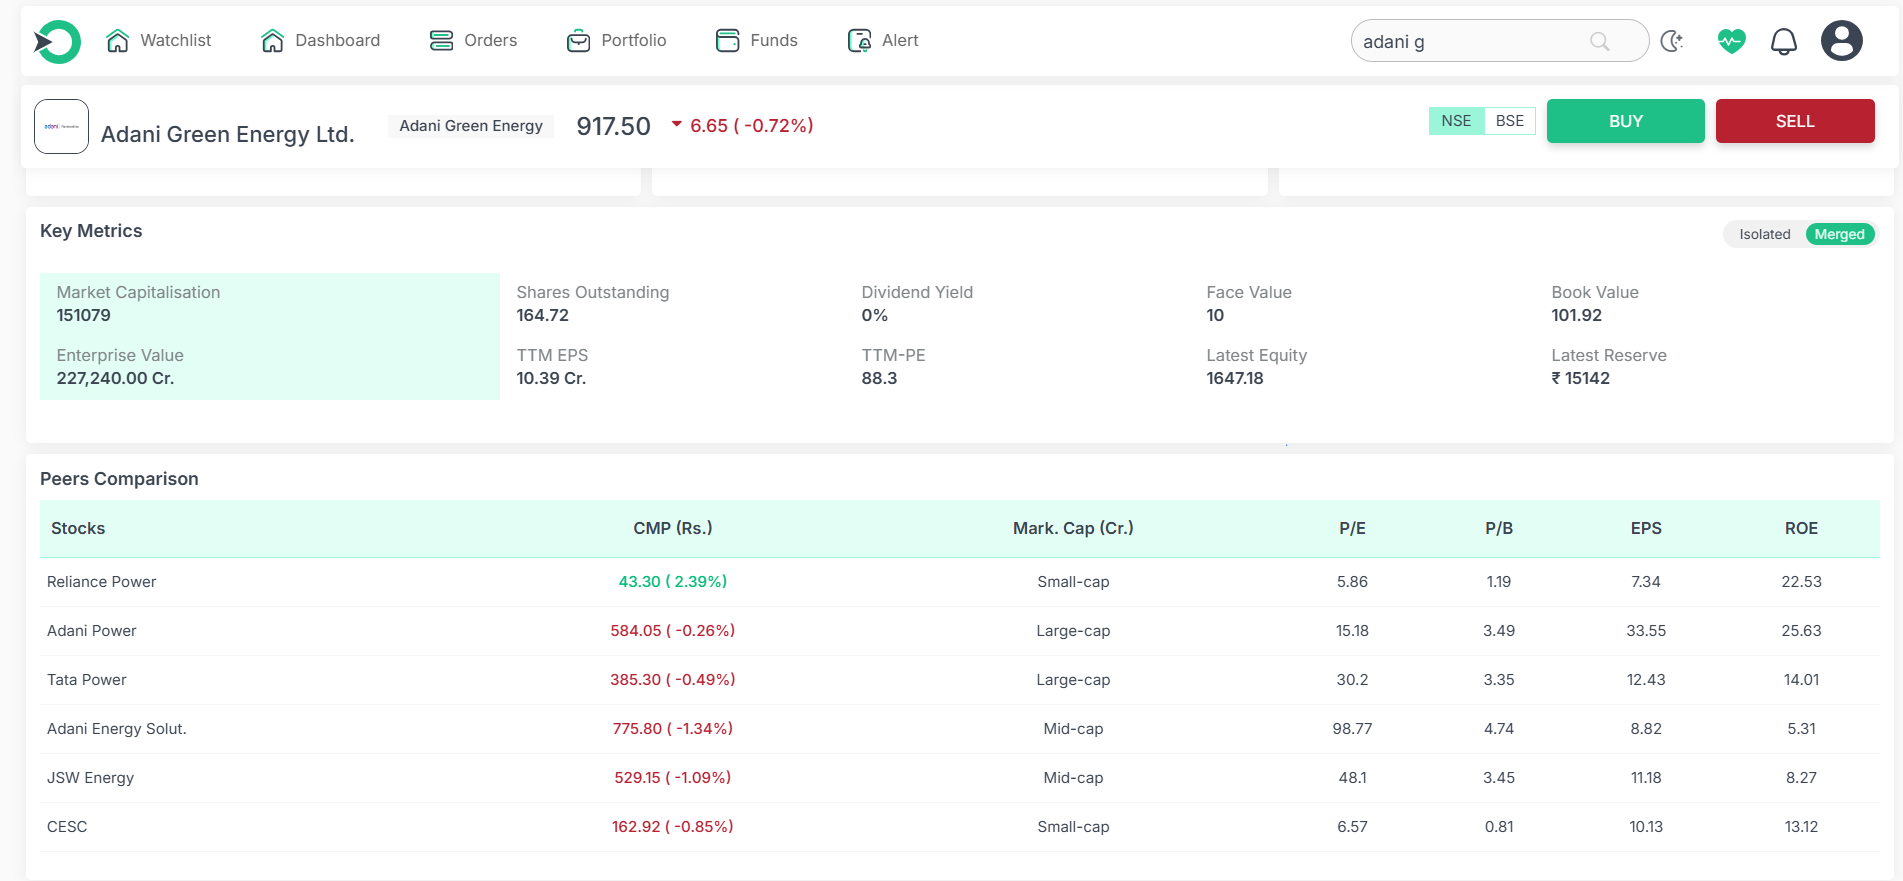
Adani Green Energy Limited, a 2015-established Adani Group flagship, has become India's largest pure-play renewable energy producer. The company develops, owns, and operates big-ticket solar, wind, and hybrid projects in the country. ADANI GREEN's operational capacity stood at almost 16 GW as of Q1 FY26, backed by milestone projects like the Khavda renewable energy park in Gujarat, which has earned international accolades. With a 50 GW green capacity target by 2030, Adani Green stresses its sharp focus on India's clean energy ambitions.
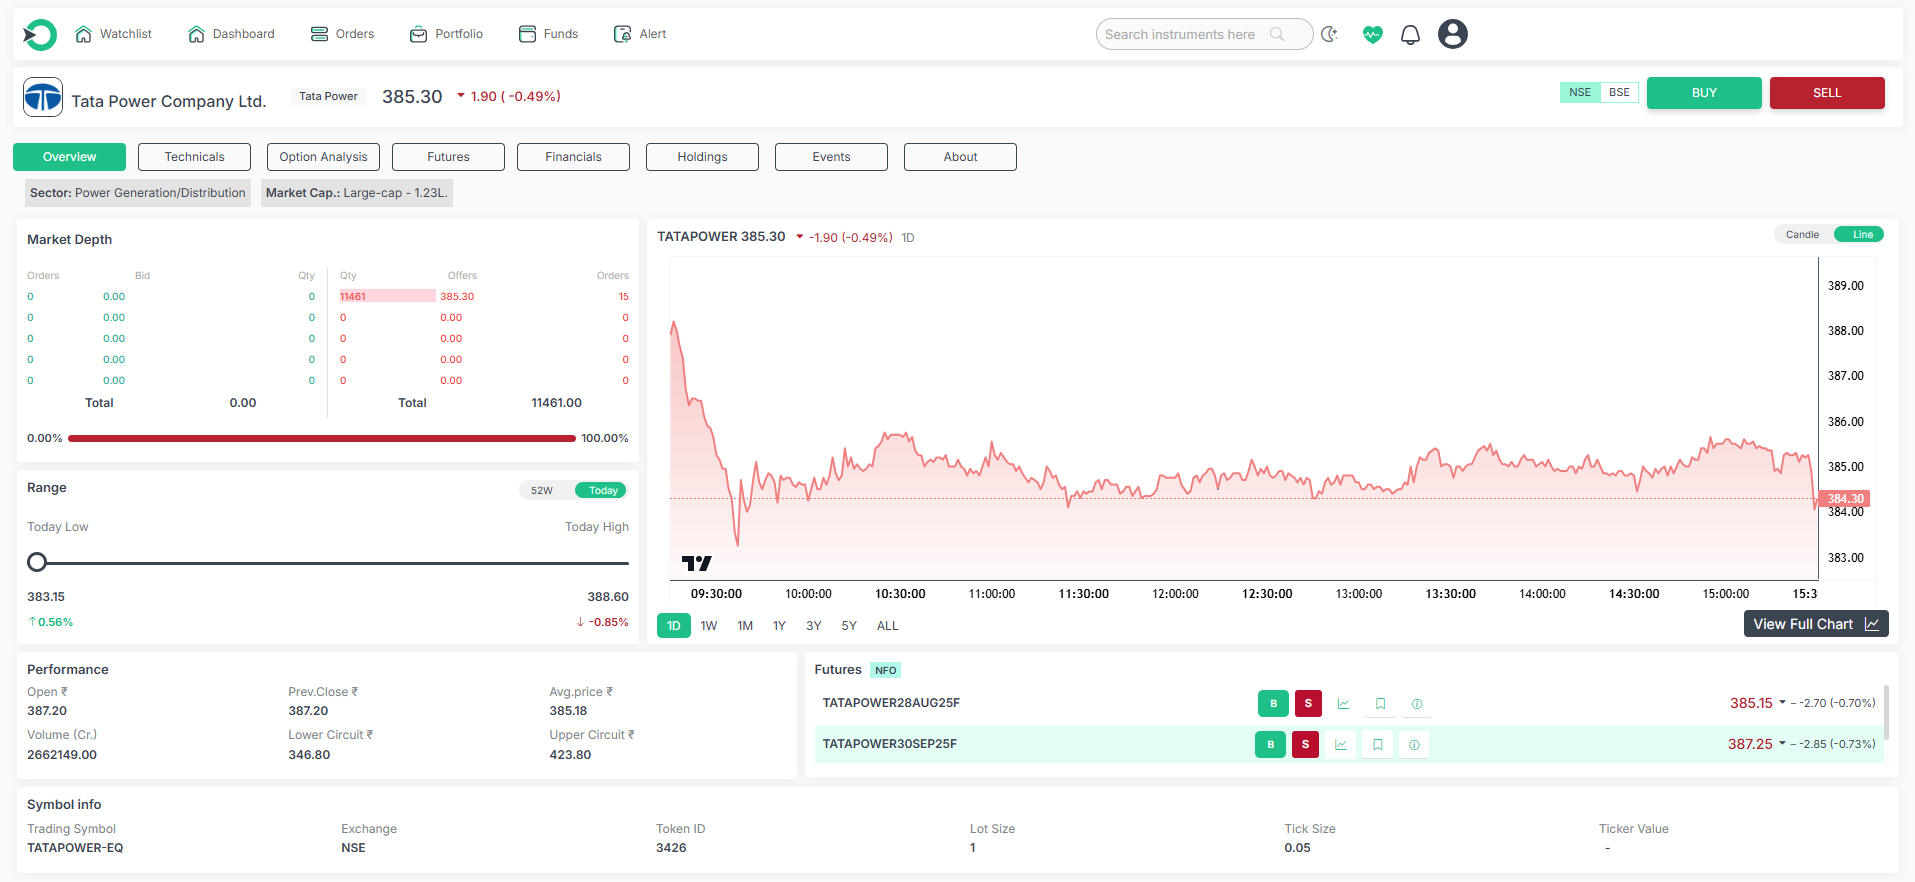
Tata Power Company Limited
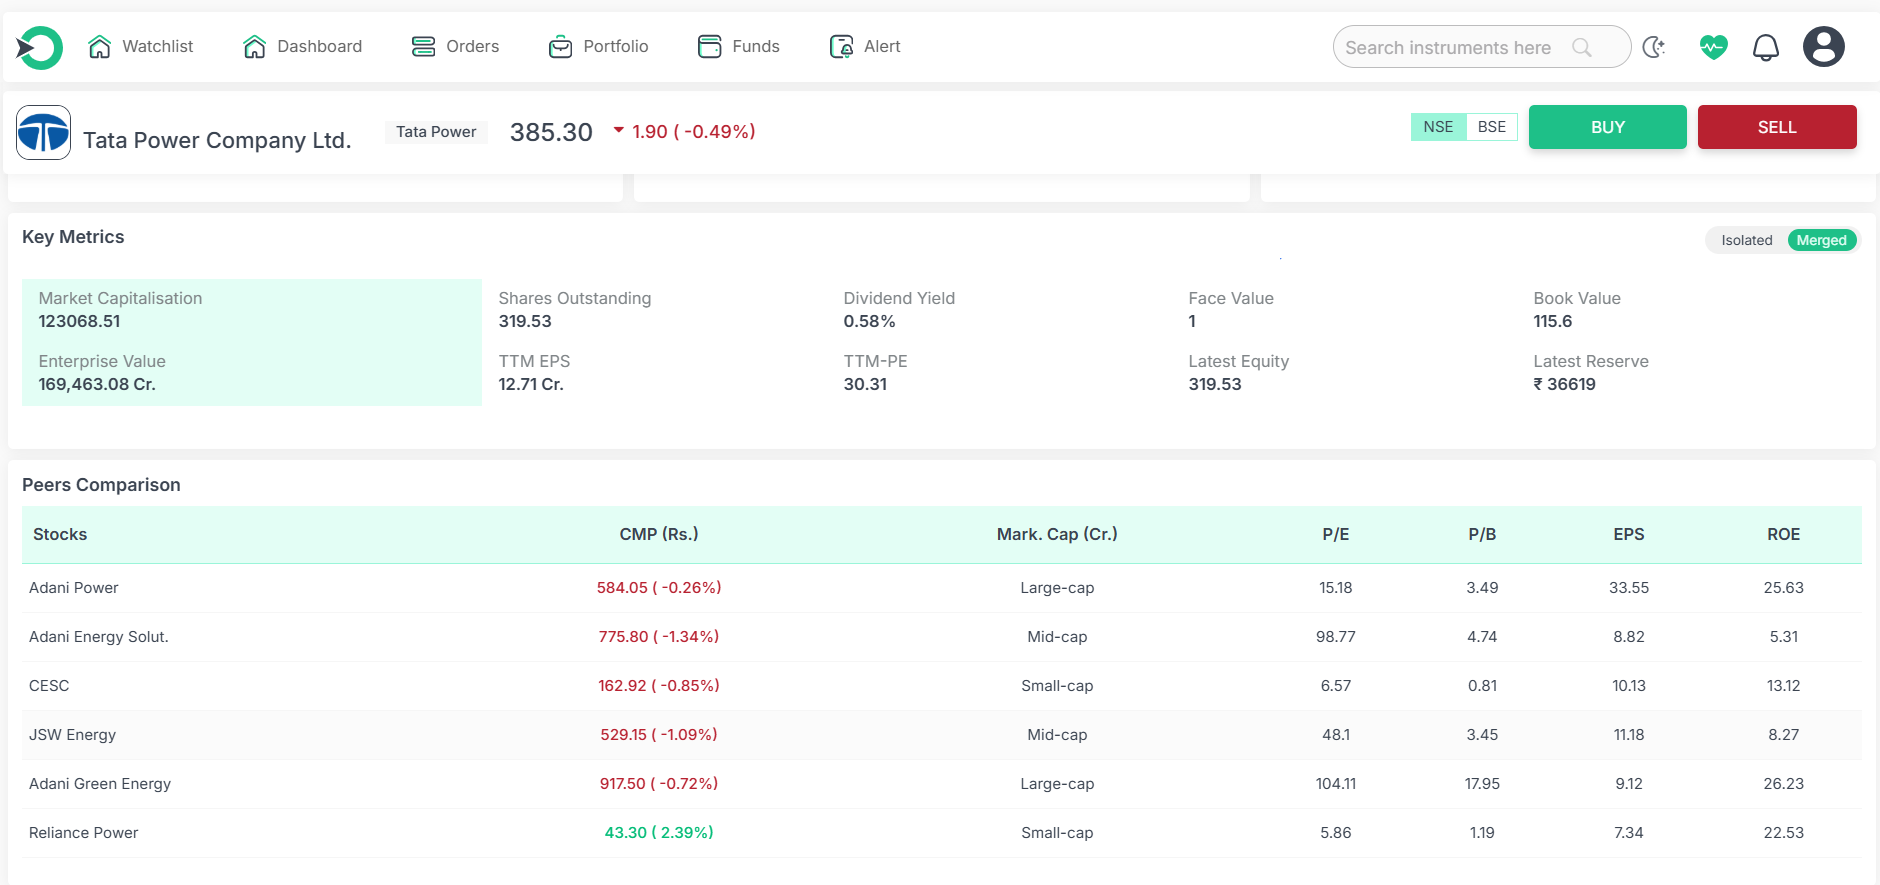
Established in 1915, Tata Power is India's most well-established and diversified energy company under the Tata Group umbrella. With more than a century of experience, it spans the entire energy spectrum—from generation (thermal, hydro, solar, wind) to transmission, distribution, and trading. As of the end of Q1 FY26, the company had an installed capacity in excess of 13 GW, with renewables consistently increasing their proportion according to its "green growth" approach. Tata Power is recognized for its balanced strategy—synthesizing innovation in solar rooftops, EV charging infrastructure, and storage solutions with stable revenues from regulated businesses.
Q1 FY26 Key Metrics Comparison: Adani Green Energy vs. Tata Power
Q1 FY26 (Apr-Jun 2025) results has provided a detailed insight into the manner in which Adani Green Energy Ltd (ADANI GREEN) and Tata Power Company Ltd are building India's power sector.
Key Comparison at a Glance
|
Name |
||
|
P/E |
80.92 |
29.87 |
|
Div Yield % |
0 |
0.58 |
|
ROCE % |
8.7 |
10.81 |
|
1Yr return % |
-49.89 |
-6.85 |
|
Debt / Equity |
6.59 |
1.75 |
|
CF Operations Rs.Cr. |
8364 |
12680.19 |
|
CF Operations PY Rs.Cr. |
7713 |
12504.37 |
|
EV / EBITDA |
21.37 |
11.11 |
|
NPM Prev Qtr % |
16.31 |
7.55 |
|
NPM Qtr % |
22.02 |
7 |
|
PAT Qtr Rs.Cr. |
724.08 |
1059.86 |
|
Net Profit Rs.Cr. |
713 |
1060 |
|
Renewable PAT Rs.Cr. |
not specific |
531 |
|
Installed Renewable Capacity |
15.8GW (+45% YoY) |
Added 94MW; green target 2.7GW FY26 capex |
|
Energy Sales (million units) |
10,479 (+42% YoY) |
Not specified |
|
Capital Expenditure (Capex) Rs. Cr. |
Not disclosed (high investment) |
3,700 (mainly green energy) |
|
Stock Reaction (Post Results) |
3% |
-3% |
Profitability and Valuation
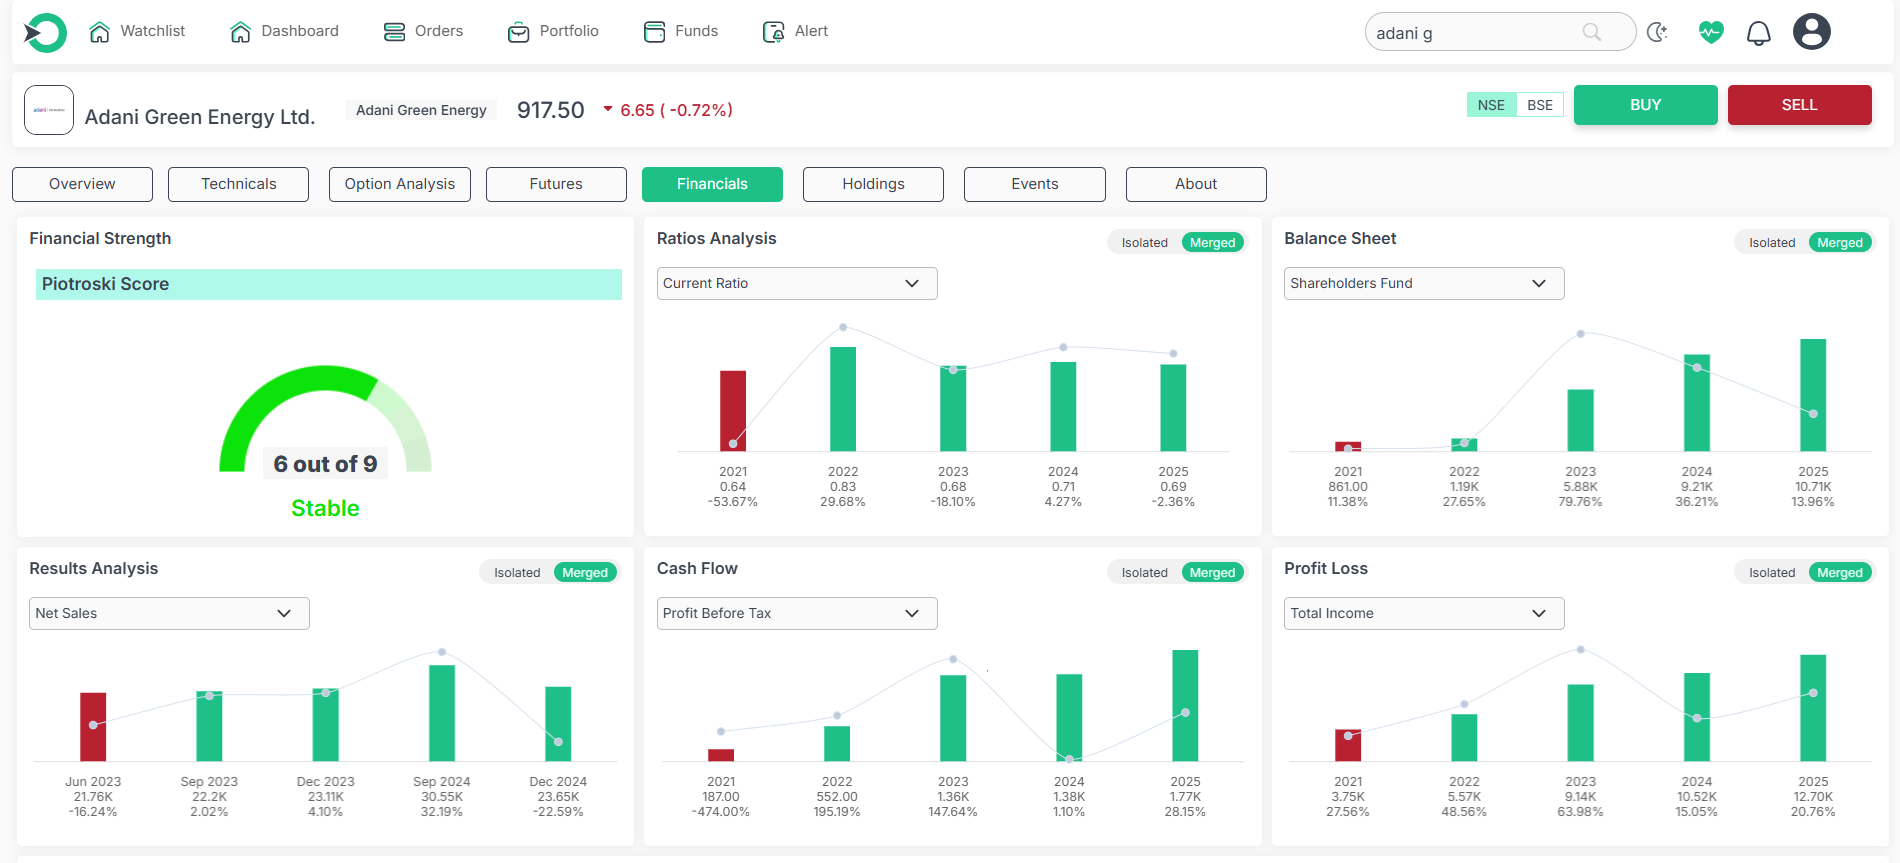
Adani Green Energy: Reported net profit of Rs.713 crore, a sharp YoY jump with a 22.02% margin (compared to 16.31% in Q4 FY25). Robust margin expansion reflects efficiency gains along with its fast-capacity additions. Its P/E ratio at 80.92 reflects high market optimism but also premium valuation.
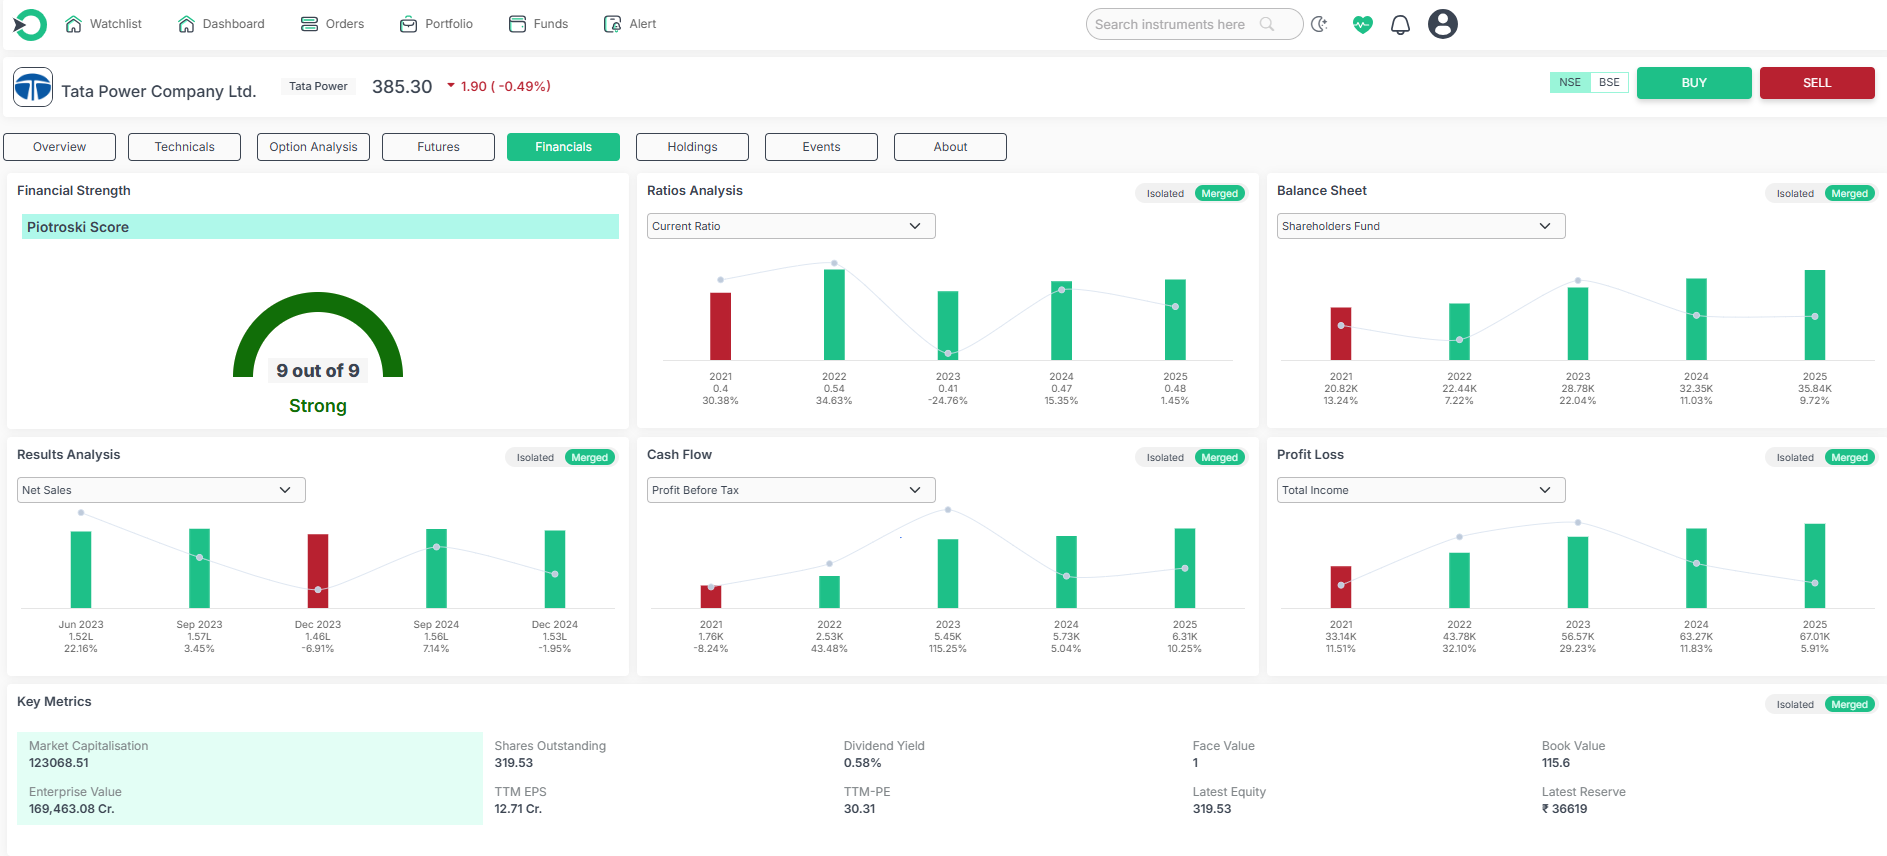
Tata Power: Registered a higher Rs.1,060 crore net profit, although margins remained at 7%, declining slightly from 7.55% in the previous quarter. With a P/E of 29.87, Tata Power is trading at a relatively more modest valuation, which is in sync with its stable earnings visibility due to its diversified business model.
Returns and Shareholder Yield
Adani Green: ROCE at 8.7% lags behind Tata Power, reflecting lesser efficiency in capital utilization, considering its high reinvestment period. No dividend was announced, as the company keeps growth in mind over dividends.
Tata Power: Recorded 10.81% ROCE, reflecting superior capital efficiency. Investors get to enjoy a modest 0.58% dividend yield, highlighting its capability to strike a balance between reinvestment and returns to shareholders.
Financial Strength and Cash Flows
Adani Green: Works on high leverage, having a debt-to-equity ratio of 6.59, in line with its capital-hungry expansion strategy. Cash generated from operations was Rs.8,364 crore, driven by efficient project implementation.
Tata Power: Has a better debt-to-equity ratio of 1.75, reflecting greater financial soundness. Generated cash from operations of Rs.12,680 crore, sustaining its scale and diversification benefit.
Operational Performance
Renewable Capacity: Adani Green is in the lead with 15.8 GW of installed capacity, a 45% YoY growth, led by solar and hybrid commissioning. Tata Power commissioned 94 MW in Q1 but has scheduled Rs.3,700 crore capex on almost 2.7 GW of renewable capacity in FY26.
Energy Sales: Adani Green retailed 10,479 million units (+42% YoY), indicating healthy market demand. Tata Power did not provide comparable numbers.
Renewables Profitability: Tata Power's renewable business reported Rs.531 crore in PAT (+95% YoY), reflecting fast growth in its diversified portfolio.
Market Reaction
Adani Green: The Adani Green share price to +3% after the results, as investors welcomed strong margin expansion and fast renewable additions.
Tata Power: The Tata Power share price fell by -3%, reflecting weaker market sentiment despite solid absolute profits and stable fundamentals.
Conclusion
Adani Green Energy: High-growth, high-risk model with compelling profitability growth and capacity expansion, but with high leverage and premium valuations.
Tata Power: Provides a balanced, lower-risk profile with greater absolute profits, more robust cash flows, conservative leverage, and stable green transition backed by dividends.
Collectively, they represent the two extremes of India's power makeover: Adani Green being the growth-hungry growth machine and Tata Power being the steady but gradually greening behemoth.
Frequently Asked Questions
What were Adani Green's and Tata Power's net profits in Q1 FY26?
The net profit of Adani Green is Rs. 713 crore and of Tata Power is Rs. 1,060 crore.
How did Adani Green’s and Tata Power’s profit margins compare in Q1 FY26?
Adani Green has made a profit margin of 22.02% due to higher efficiency and margins from renewables and Tata Power has a profit margin of 7% due to consistent margin from a diversified portfolio.
What is Adani Green Energy’s and Tata Power’s renewable energy capacity in Q1 FY26?
Adani Green has a renewable energy capacity of 15.8 GW which is up by 45% YoY on large-scale solar & wind installations) and Tata Power had added 94 MW during Q1 and has plans for 2.7 GW capacity addition in FY26.
How did the stock market react to Adani Green Energy and Tata Power’s Q1 FY26 results?
Adani Green share price gained +3% influenced by investor enthusiasm on growth momentum and Tata Power share price fell to -3% influenced by dull sentiment despite robust fundamentals.
What are the key differences in financial leverage between Adani Green Energy and Tata Power?
Adani Green has a Debt-to-equity of 6.59 which is an aggressive leverage and growth-oriented strategy while Tata Power has a Debt-to-equity of 1.75 which is a prudent leverage with higher stability.
Disclaimer: This blog is dedicated exclusively for educational purposes. Please note that the securities and investments mentioned here are provided for informative purposes only and should not be construed as recommendations. Kindly ensure thorough research prior to making any investment decisions. Participation in the securities market carries inherent risks, and it's important to carefully review all associated documents before committing to investments. Please be aware that the attainment of investment objectives is not guaranteed. It's important to note that the past performance of securities and instruments does not reliably predict future performance.