CRUDEOIL
Monday 24 November, 2025
Short term -Technical Outlook
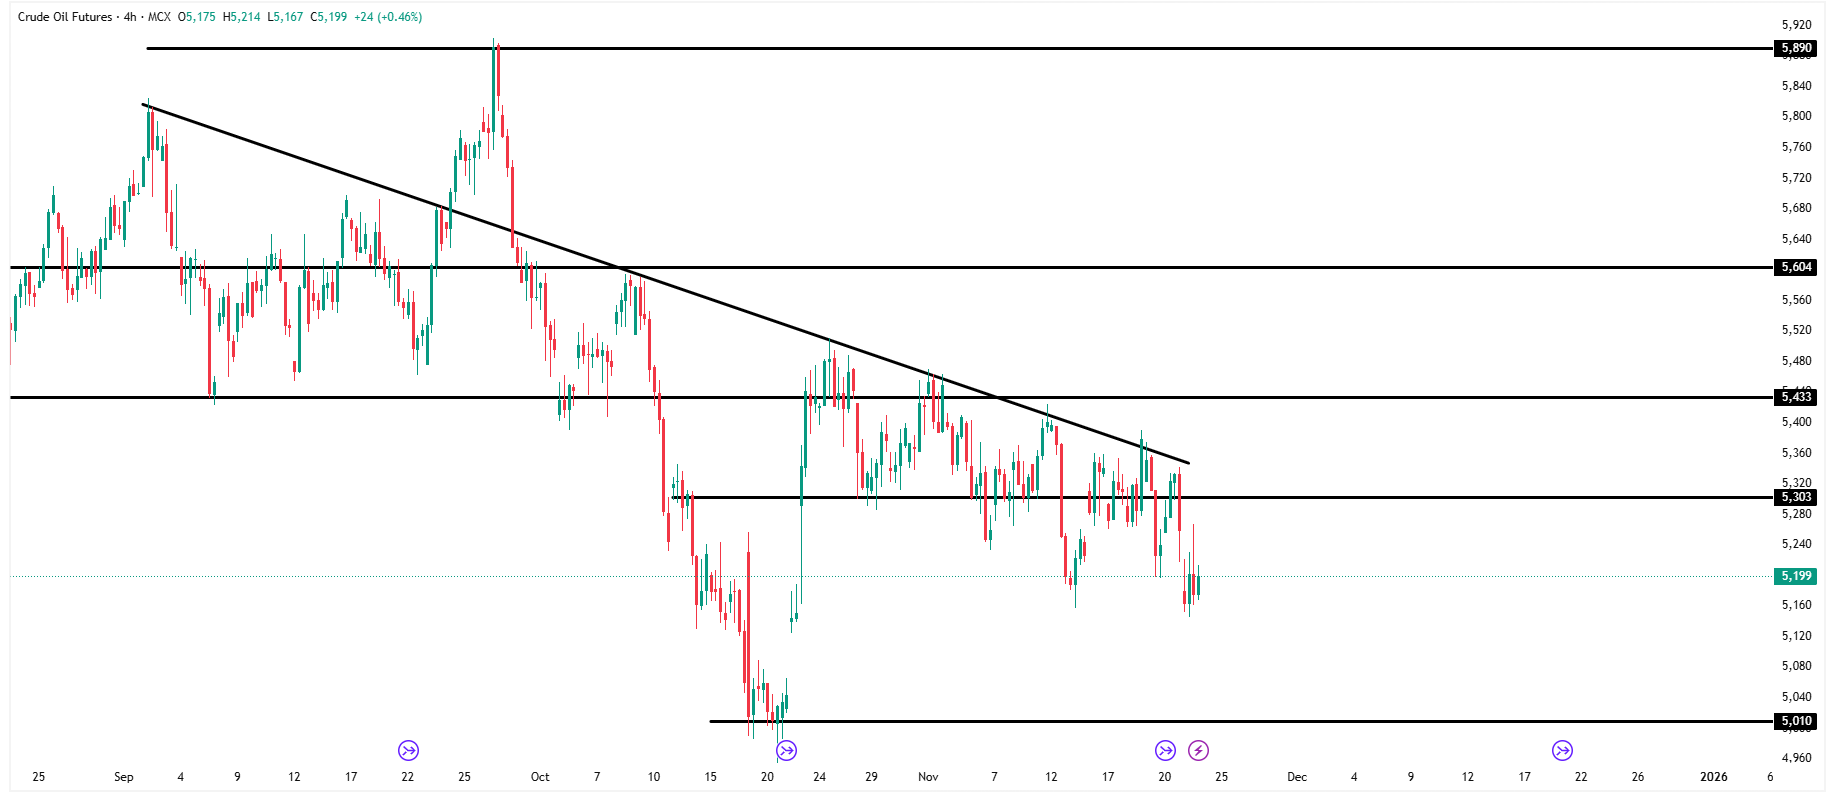
Crude Oil futures are currently trading around 5,199, showing continued weakness after failing to break above the trendline resistance drawn from the September swing highs. The price has repeatedly rejected the 5,303–5,433 supply zone, confirming strong overhead pressure and sustaining a bearish market structure.The latest breakdown below 5,303 indicates that sellers remain dominant, and the trend continues to print lower highs and lower lows. As long as crude remains below 5,303, the downside momentum is intact. A sustained decline below 5,175 could extend the bearish leg toward 5,080–5,010, which acts as a major demand zone and historical support.On the upside, any pullback toward 5,303 may invite short build-up unless crude breaks decisively above 5,433, which would be the first sign of trend reversal. A close above 5,433 could trigger short-covering toward 5,520–5,604.Overall, the structure remains bearish, and crude may stay under pressure unless strong momentum breaks the descending resistance line.
Short-Term Research Report Call
Buy Above: 5,260 | Targets: 5,280 – 5,320 | Stop-Loss: 5,130
Sell Below: 5,175 | Targets: 5,080 – 5,010 | Stop-Loss: 5,240
short term chart
Validity
18/12/2025
Pivot
5203.33
Buy Above
5222.69
R1
5249.31
R2
5277.14
R3
5326.75
Stop Loss
5215.43
Pivot
5203.33
(All values are in INR)
Sell Below
5183.97
S1
5157.35
S2
5129.52
S3
5079.91
Stop Loss
5191.23
GOLD
Monday 24 November, 2025
Short Term Technical Outlook
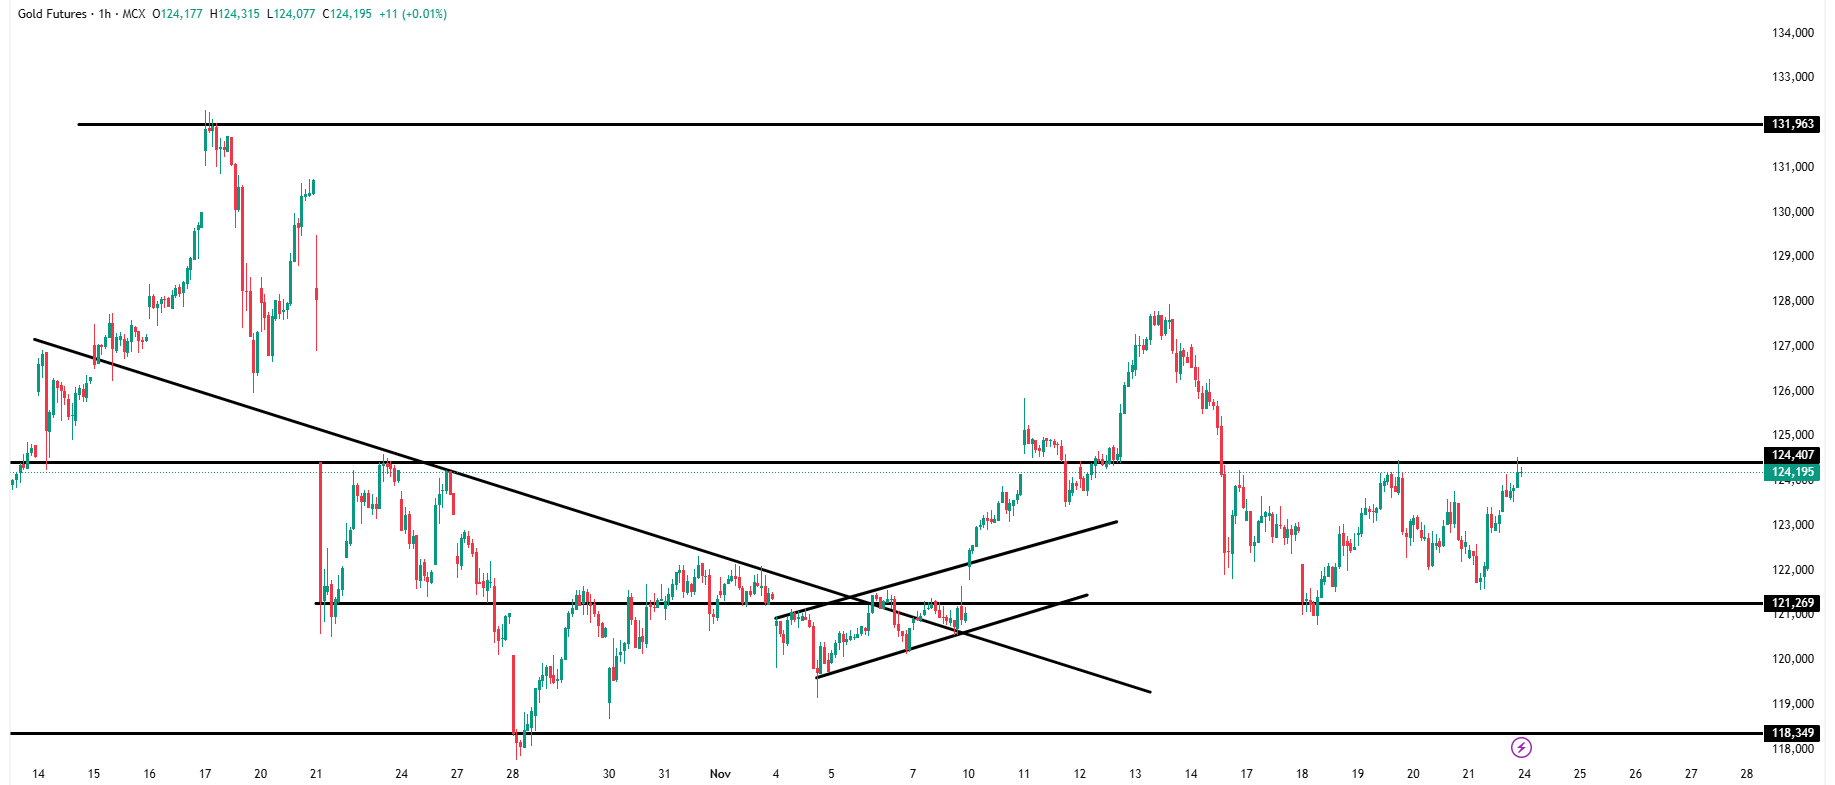
Gold futures are currently trading near 124,195, showing a steady recovery after bouncing from the support zone of 121,269. The price has reclaimed the short-term trendline and is now retesting the 124,407 resistance area, which has acted as a key supply zone multiple times.Market structure indicates improving bullish sentiment, supported by higher lows forming since the 121,269 level. A clean breakout above 124,407 could trigger a fresh upward move toward 125,500 – 127,000.However, if price fails to sustain above 124,407, a pullback toward 123,200 – 121,269 is likely.
Momentum remains neutral to mildly bullish, with buyers gradually regaining control but needing a breakout confirmation for stronger trend continuation.
Short-Term Research Report Call
Buy Above: 124,407 | Targets: 125,500 – 127,000 | Stop-Loss: 123,200
Sell Below: 121,269 | Targets: 120,000 – 118,349 | Stop-Loss: 122,200
Short term Chart
Validity
05/12/2025
Pivot
123425.00
Buy Above
123903.72
R1
124561.96
R2
125250.12
R3
126476.84
Stop Loss
123724.20
Pivot
123425.00
(All values are in INR)
Sell Below
122946.28
S1
122288.04
S2
121599.88
S3
120373.16
Stop Loss
123125.80
NATURAL GAS
Monday 24 November, 2025
Short Term Technical Outlook
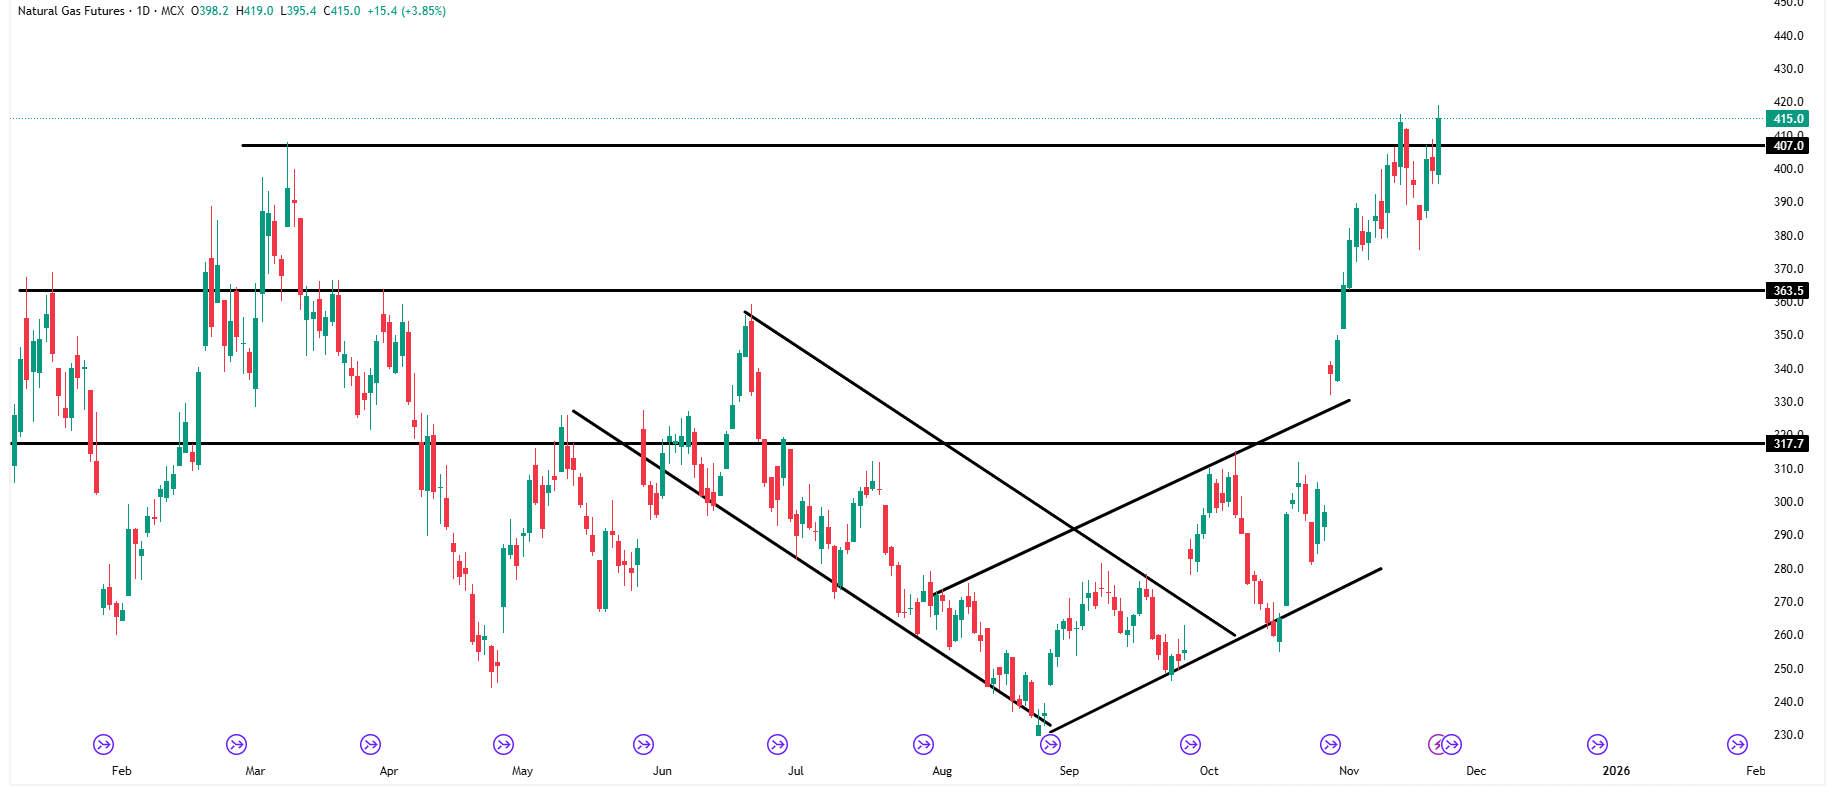
Natural Gas futures are currently trading near 415, maintaining a strong bullish structure after a powerful breakout above the major resistance levels at 363 and 407. The recent price action shows a clear higher-high and higher-low formation, confirming trend continuation after breaking out of the long-term falling channel.Prices have now tested the 415–420 resistance zone, which is a major multi-month supply area. Despite the overextended rally, buyers continue to dominate as long as the price sustains above 394 — now a strong demand zone created from the breakout.A decisive close above 420 will signal further bullish expansion, potentially pushing Natural Gas toward 435–450. However, a short-term pullback toward 394–407 is possible due to sharp profit booking and stretched momentum.Below 394, the bullish momentum may weaken, opening a corrective phase toward 363, the earlier breakout base.
Short-Term Research Report Call
Buy Above: 420 | Targets: 435 – 450 | Stop-Loss: 402
Sell Below: 394 | Targets: 380 – 363 | Stop-Loss: 408
Short term chart
Validity
26/12/2025
Pivot
424.07
Buy Above
426.93
R1
430.87
R2
434.99
R3
442.32
Stop Loss
425.86
Pivot
424.07
(All values are in INR)
Sell Below
421.20
S1
417.26
S2
413.15
S3
405.81
Stop Loss
422.28
Note: Above information is not recommending any buy or sell position, this is for your reference only and trading or investment in commodities & derivatives is subject to market risk.
Disclaimer: Investment in securities/commodities market subject to market risk, read all the related documents carefully before investing/trading.
Analyst Certification: I/We, Ayushi Jain Research Analyst, authors, and the name subscribed to this report, hereby certify that all the views expressed in this research report accurately reflect our views about the subject issuer(s) or securities. We also certify that no part of our compensation was, is, or will be directly or indirectly related to the specific recommendation(s) or view(s) in this report. NISM Research Analyst registration number – NISM-201900015194.
