Nifty IT Stock Comparison: Investing in the Future of Tech
Information Technology Industry
The Indian Information Technology Industry is rapidly enhancing its potential in digital technology. India is concentrating on development of niche technologies like Generative Artificial Intelligence (Gen AI), Cybersecurity and Internet of Things (IoT).
India in FY 2022 has achieved to be the second country to include 23 more new unicorns , about 1300 new technology startups and about two lakhs’ employees digitally trained.
As per reports from Invest India , the Information technology industry contributes 7% share in India's GDP, 57% share in global sourcing, 38% share in export services, 60% firms utilize Indian IT for testing services. In 2023, Indian IT industry's revenue contributed is $254 billion and growth at 9.4% ,
2024 Forecast
India's IT expenditure is forecasted to be $138.9 billion in 2024 and growth rate to be 13.2% . Indian IT segments like software, IT services , data centre services, hardware’s are expected to grow in 2024.
Global IT expenditure is forecasted to be $5.06 trillion in 2024. The growth of the IT industry is driven by Generative AI processing, data center systems etc…
Nifty IT Stocks
The Indian Information Technology industry has played a prominent role in the growth of the Indian economy over the past few decades. The stock exchange has developed the Nifty IT benchmark to help the market players to monitor the IT industry performance. Nifty IT Index is useful in benchmarking fund portfolios, launching of new index funds and new financial products.
Nifty IT index was traded since 1st January1996 which is reconstituted and rebalanced on a semi - annual basis. The Nifty IT index constitutes 10 companies listed on NSE with a base value of 100.
|
Company Name |
Industry |
Weight % |
|
Infosys Ltd. |
IT |
26.71 |
|
Tata Consultancy Services Ltd. |
IT |
25.76 |
|
Tech Mahindra Ltd. |
IT |
10.61 |
|
HCL Technologies Ltd. |
IT |
9.62 |
|
Wipro Ltd. |
IT |
8.63 |
|
LTIMindtree Ltd. |
IT |
5.71 |
|
Persistent Systems Ltd. |
IT |
4.6 |
|
Coforge Ltd. |
IT |
4.13 |
|
MphasiS Ltd. |
IT |
2.55 |
|
L&T Technology Services Ltd. |
IT |
1.69 |
Performance Comparison of all Sector Indices for a period of 1 year in NSE
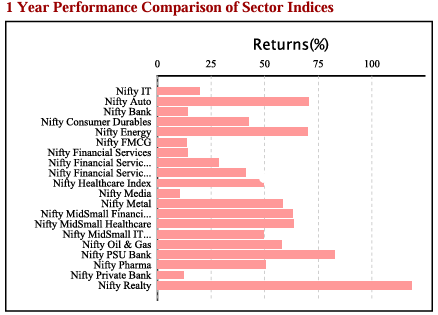
Nifty IT stocks have delivered a total return of 19.82% for a period of 1 year. The total return for a period of 1 year is 21.91%. The total price return on quarter to date was - 4.86% and year to date was -6.24% .
Historical Price Analysis of Nifty IT for a period of 1 year
The price to equity ratio is 27.98 and price to book ratio is 7.14. Nifty IT index has delivered a dividend yield of 2%.
Eligibility Criteria for Nifty IT Constituent Stock
-
The stock considered for Nifty IT constituents should be part of Nifty 500 .
-
If the number of Nifty 500 stocks eligible for Nifty IT falls below 10, then the remaining stocks will be selected from top 800 stocks particularly of the IT sector based on daily turnover and market capitalization.
-
The stock companies should belong to the IT sector.
-
The company's trading frequency should be of at least 90% in the past six months.
-
The Company should have a minimum listing history of 1 month as on the cutoff date.
-
Final selection of 10 companies will be based on the free-float market capitalization method.
-
A priority will be given to stocks that are available for trading in NSE’s Futures & Options segment.
-
Weightage of each stock in Nifty IT index is calculated such that no single stock should be more than 33% and weightage of top 3 stocks cumulatively should not be more than 62% at the time of rebalancing.
Nifty IT Stock Comparison
To analyze the Nifty IT stocks, let’s consider three of the Nifty IT Stocks for comparative analysis.
Welcome the future of investing with Enrich Money. Avail free demat trading account from Enrich Money, a wealth tech management company .
Let’s consider the below stocks for comparative analysis.
Intraday Price Comparative Analysis
|
Stock Name (as of 21st May, 2024) |
Tata Consultancy Services Limited |
Infosys Limited |
Tech Mahindra Limited |
|
Open (INR) |
Rs.3830.60 |
Rs. 1430 |
Rs.1307 |
|
High (INR) |
Rs.3844.75 |
Rs. 1444.70 |
Rs. 1304.10 |
|
Low (INR) |
Rs.3810.05 |
Rs. 1428.40 |
Rs. 1327 |
|
Last Traded Price (INR) |
Rs.3820.20 |
Rs.1434.15 |
Rs.1323.90 |
|
Price Change (INR) |
-Rs. 31.25 |
-Rs.9.50 |
Rs.18.25 |
|
Price Change (%) |
-0.81% |
-0.66 % |
1.40% |
|
Volume |
1908117 |
6752663 |
1453689 |
|
Previous Close (INR) |
Rs.3851.45 |
Rs. 1443.65 |
Rs.1305.65 |
Based on the intraday price analysis, Tech Mahindra Limited is traded at a price change of 1.40 % .
Monthly Price Comparative Analysis
|
Stock Name |
Tata Consultancy Services Limited |
Infosys Limited |
Tech Mahindra Limited |
|
Date |
Closing Price in INR |
||
|
May 21, 2024 |
3,820.20 |
1,434.15 |
1,323.90 |
|
May 1, 2024 |
3,834.10 |
1,444.30 |
1,305.40 |
|
Apr 1, 2024 |
3,820.65 |
1,420.55 |
1,263.50 |
|
Mar 1, 2024 |
3,876.30 |
1,498.05 |
1,248.10 |
|
Feb 1, 2024 |
4,095.10 |
1,673.90 |
1,273.85 |
|
Jan 1, 2024 |
3,815.95 |
1,660.90 |
1,333.65 |
|
Dec 1, 2023 |
3,793.40 |
1,542.90 |
1,272.65 |
|
Nov 1, 2023 |
3,487.60 |
1,455.15 |
1,220.95 |
|
Oct 1, 2023 |
3,368.75 |
1,368.40 |
1,133.15 |
|
Sep 1, 2023 |
3,528.60 |
1,435.45 |
1,222.80 |
|
Aug 1, 2023 |
3,356.80 |
1,435.45 |
1,201.95 |
|
Jul 1, 2023 |
3,421.45 |
1,355.70 |
1,115.50 |
|
Jun 1, 2023 |
3,302.25 |
1,335.50 |
1,130.85 |
While observing the monthly stock price data, the stock price of TCS Limited, Infosys Limited and Tech Mahindra Limited. The price change for TCS Limited is 15.68%, Infosys Limited is 7.38% and Tech Mahindra Limited is 17.07%.
Chart Analysis
Tata Consultancy Services Limited
TCS Limited, operates in the business of providing IT services , consultancy and business solutions organizations worldwide . TCS Limited is headquartered in Mumbai, India. TCS Limited is one of the subsidiaries of Tata Groups . Its portfolio of business includes software development, IT infrastructure and BPO.
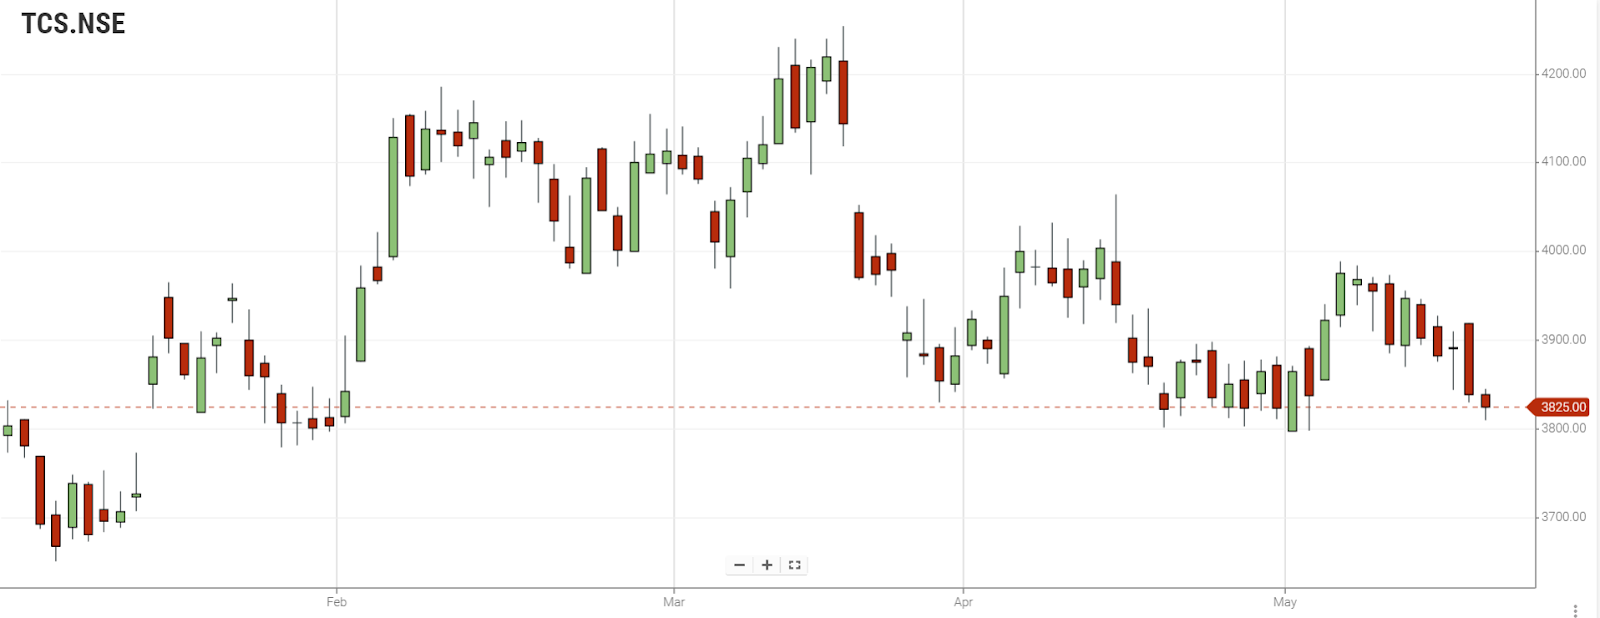
The Bearish Continuation Heikin Ashi pattern is formed on daily charts. Consolidation Heiki Ashi with the previous spinning top is observed on monthly price data.
Infosys Limited
Infosys Limited , operates in the business of consulting, technology and next generation digital services. The company is headquartered in Bengaluru, India. Its portfolio of business includes IT consulting, software development and BPO.
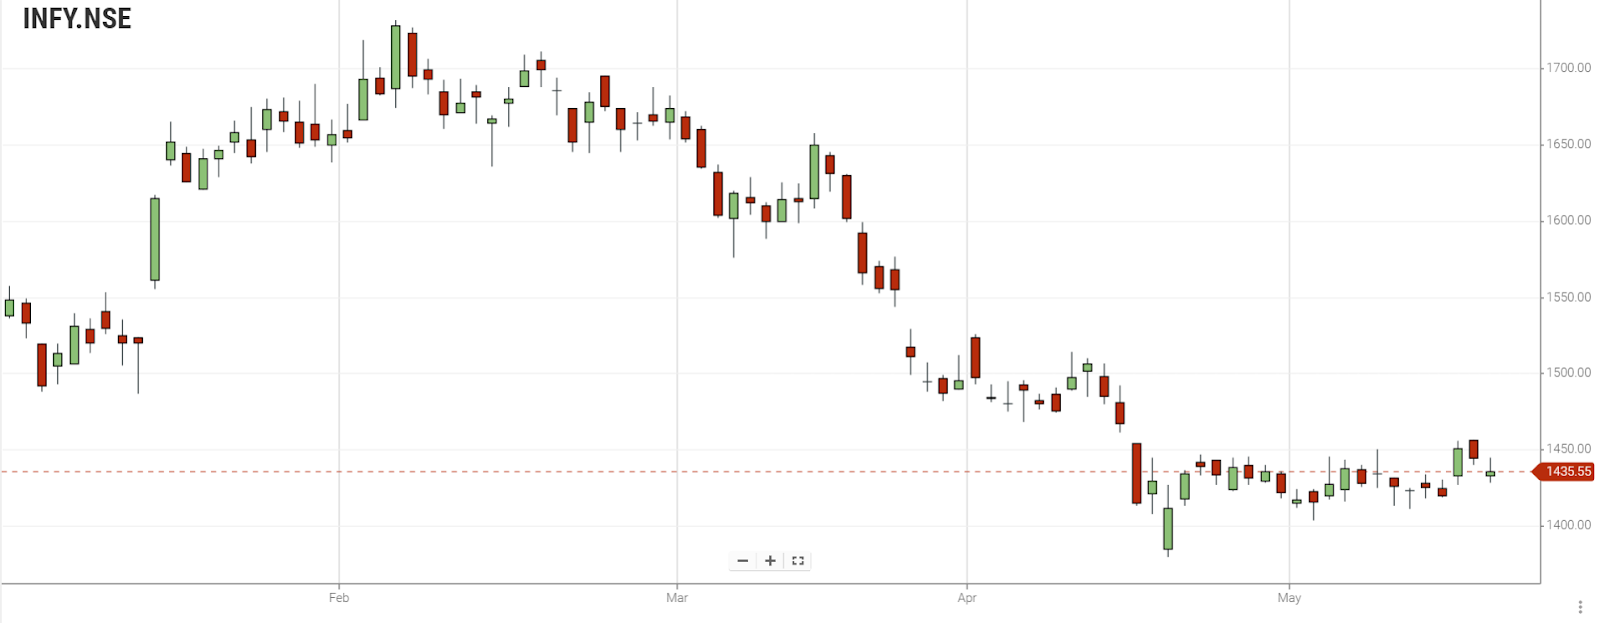
Bearish Initiation Heikin Ashi pattern is formed on daily charts. Bearish Continuation Heikin Ashi pattern is observed on monthly price data.
Tech Mahindra Limited
Tech Mahindra , operates in the business of consulting, digital transformation, BPR services and solutions. It’s headquartered in Pune, India. Tech Mahindra is a part of Mahindra Group. Its portfolio of business includes IT consulting, cloud solutions, cybersecurity and enterprise software development.
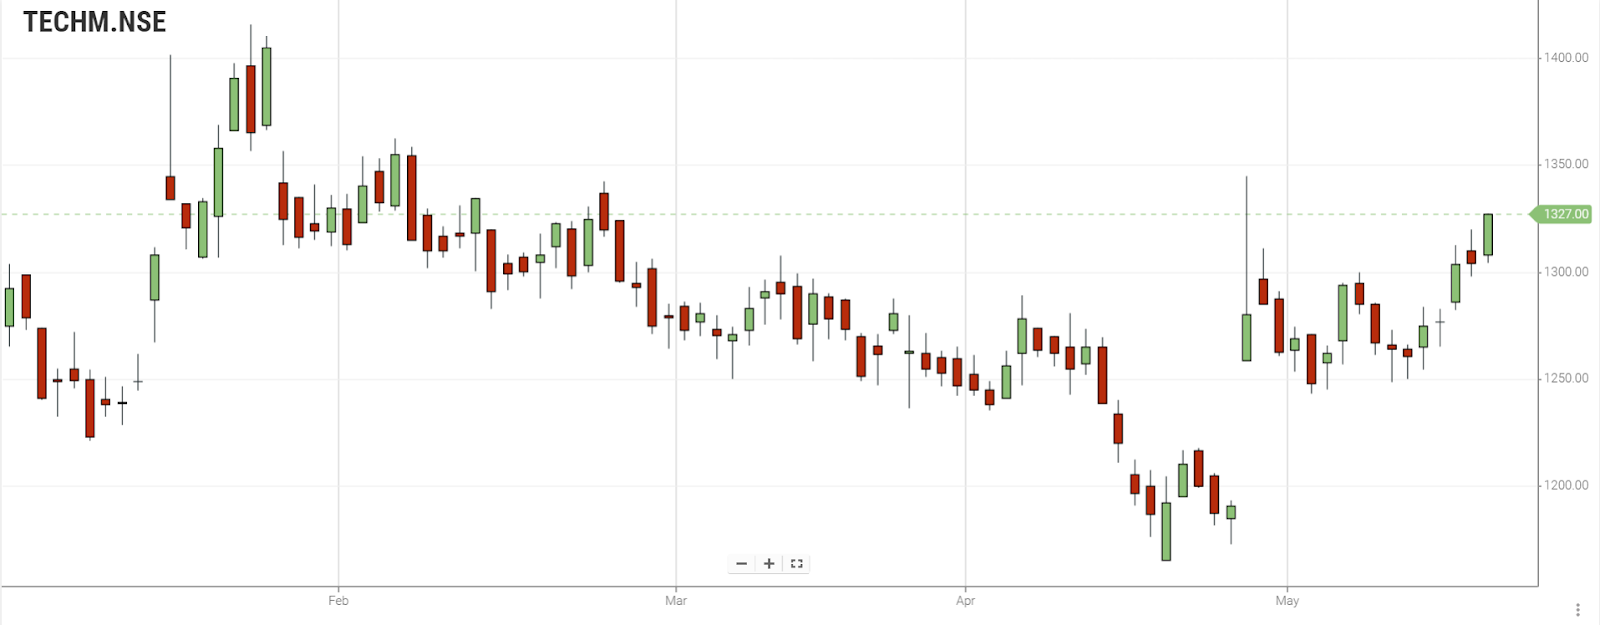
The Bullish Continuation Heikin Ashi pattern is formed on daily charts. On monthly price data charts, a Bullish Heikin Ashi pattern with ticks from red to green is formed.
Fundamental Analysis
|
Stock Name |
Tata Consultancy Services Limited |
Infosys Limited |
Tech Mahindra Limited |
|
Market Cap (in INR Crores) |
1392963.7 |
599376.37 |
127537.62 |
|
Dividend Yield % |
1.9% |
3.19% |
3.06% |
|
TTM EPS (in INR Crores) |
126.88 |
63.19 |
24.13 |
|
TTM PE |
30.34 |
22.85 |
54.09 |
|
P/E |
30.62 |
23.66 |
20.07 |
|
P/B |
15.58 |
7.12 |
3.52 |
|
EPS |
126.82 |
63.33 |
54.9 |
|
ROE |
51.04 |
32.46 |
17.98 |
Tata Consultancy Services Limited
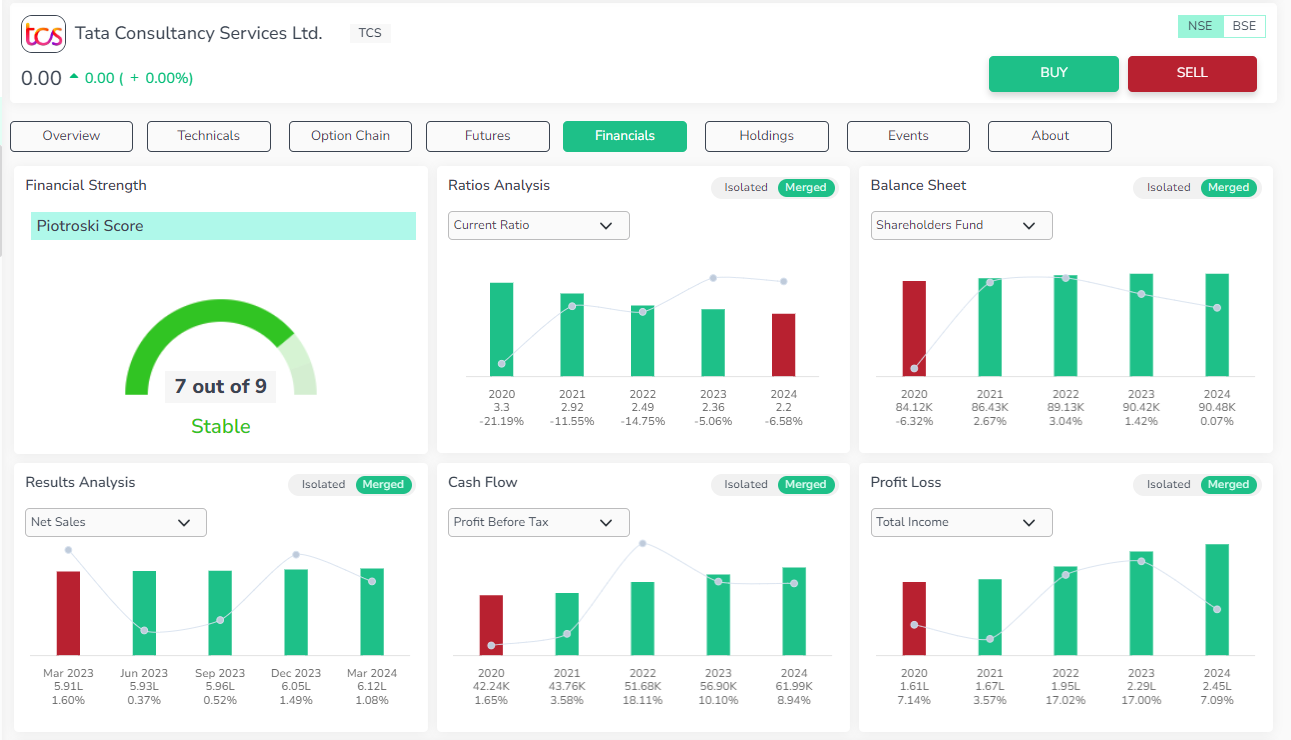
Valuation - The stock is overvalued. And the book value of the stock has been uptrend in the last three years.
Profitability -The stock has a good piotroski score , with excellent EPS growth . The net profit margin is very good , which is in uptrend in the last three years. All the profitability metrics are excellent.
Growth - The company is trending up in growth aspects in the last three years.
Stability - The stock has excellent stability.
Infosys Limited
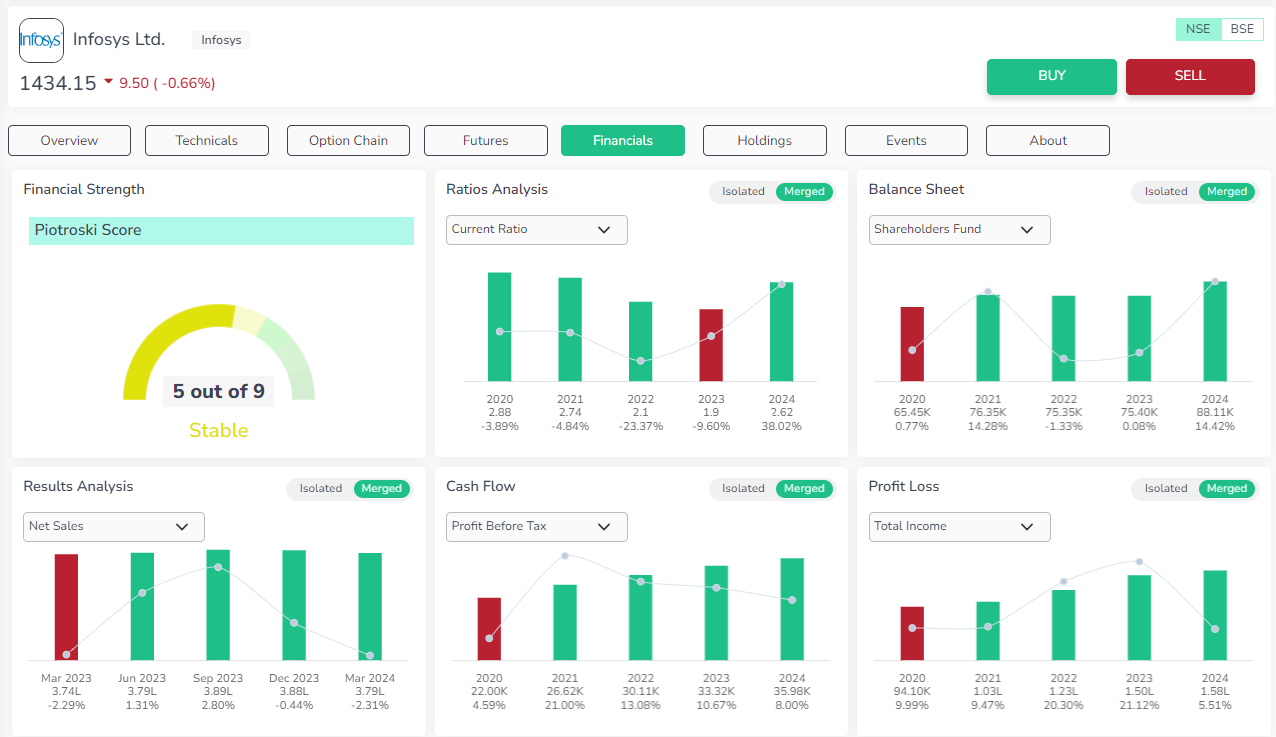
Valuation - The stock is overvalued. And the book value of the stock has been uptrend in the last three years.
Profitability -The stock has a stable piotroski score , with incredible EPS growth . All the profitability metrics are incredibly positive.
Growth - The company is trending up in growth aspects in the last three years. Except the operating cash flow is decreasing in the last three years.
Stability - The stock has excellent stability and debt free.
Tech Mahindra Limited
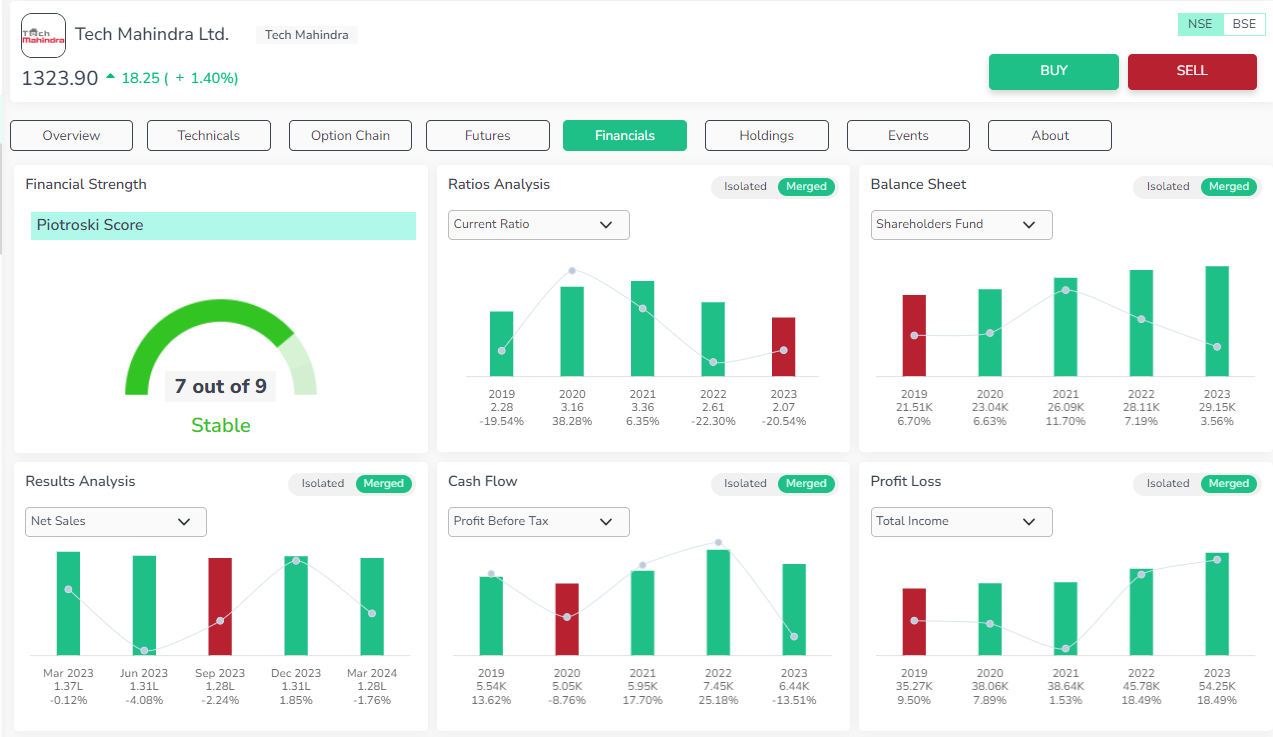
Valuation - The stock is undervalued. But the book value of the stock has been in a downtrend in the last three years.
Profitability -The profitability metrics indicate negative aspects and the stock has very low earning yield. However, the dividend yield of the stock is excellent.
Growth - The company is having poor growth aspects.
Stability - The stock has excellent stability.
Technical Analysis
To gain detailed insights on technical and fundamentals of stocks, log into Orca app.
|
Technical Analysis @ 21.05.2024 |
|||
|
Stock Name |
Tata Consultancy Services Limited |
Infosys Limited |
Tech Mahindra Limited |
|
Moving Averages |
|||
|
SMA 20 Days |
3906.07 |
1428.23 |
1249.97 |
|
EMA 20 Days |
3920.74 |
1437.68 |
1260.06 |
|
SMA 200 Days |
3711.26 |
1495.95 |
1241.57 |
|
EMA 200 Days |
3744.56 |
1491.41 |
1228.71 |
|
Indicators |
|||
|
RSI |
47.53 |
40.64 |
55.34 |
|
CCI |
1.09 |
-52.59 |
49.67 |
|
WILLIAMS_R |
-66.1 |
-81.15 |
-66.7 |
|
UO |
52.56 |
48.33 |
55.88 |
|
Rate of Change |
0.46 |
0.18 |
0.62 |
|
MACD |
-8.77 |
-18.52 |
7.4 |
|
ADX |
0 |
0 |
0 |
|
Standard Pivot Levels |
|||
|
R4 |
3900.8 |
1425.9 |
1284.6 |
|
R3 |
3895.85 |
1424.43 |
1282.03 |
|
R2 |
3890.9 |
1422.97 |
1279.47 |
|
R1 |
3886.8 |
1421.48 |
1278.18 |
|
Pivot |
3881.85 |
1420.02 |
1275.62 |
|
S1 |
3877.75 |
1418.53 |
1274.33 |
|
S2 |
-3881 |
-1420.03 |
-1274.33 |
|
S3 |
3868.7 |
1415.58 |
1270.48 |
|
S4 |
3864.6 |
1414.1 |
1269.2 |
Tata Consultancy Services Limited
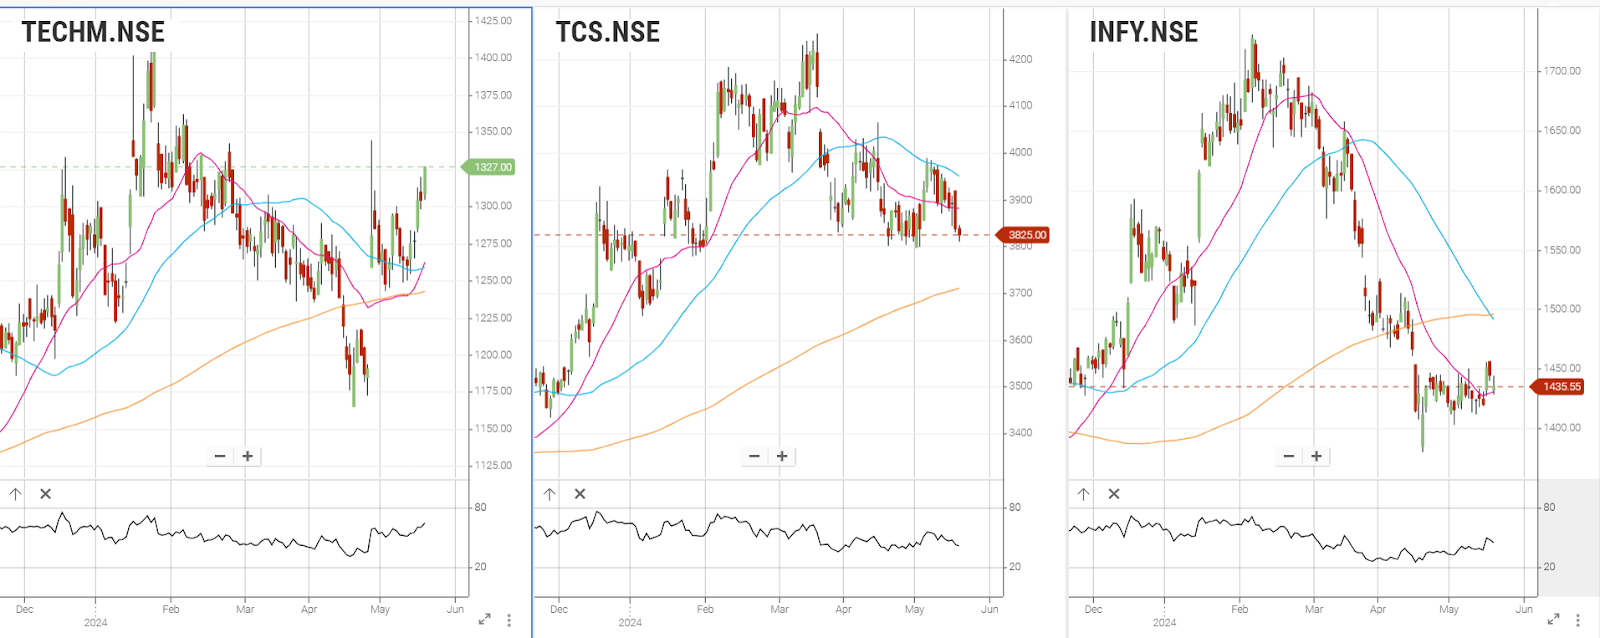
SMA and EMA levels indicate that stock exhibits bullish signals. The technical indicators imply that the stocks would follow a bullish pattern.
Infosys Limited
SMA and EMA levels indicate that stock exhibits strong bullish signals. The technical indicators imply that the stocks would follow a bullish pattern.
Tech Mahindra Limited
SMA and EMA levels indicate that stock exhibits bullish signals. The technical indicators imply that the stocks would follow a bullish pattern.
The below chart exhibits the comparative technical study of three Nifty IT stocks based on Moving average crossover signals and Relative strength index for a period of 6 months.
Conclusion
A comprehensive Nifty IT stock comparison using charts, price data, technical, and fundamentals provides valuable insights into market performance. This analysis helps investors make informed decisions, manage risks effectively, and optimize returns in the dynamic IT sector.
Enrich Money’s Orca app provides investors with in depth analysis of stock momentum. Investors are advised to make thorough analysis using technical and fundamental tools before taking any investment decision.
Frequently Asked Questions
What is Nifty IT?
Nifty IT is an index designed to track the performance of the top IT companies listed on the National Stock Exchange (NSE) of India. It includes 10 companies that are representative of the IT sector in India.
How is the Nifty IT index calculated?
The Nifty IT index is calculated using the free-float market capitalization method, where the level of the index reflects the total market value of all the stocks in the index relative to a particular base period.
What are the key factors driving the growth of the Nifty IT index?
Key factors driving the growth include advancements in digital technologies, strong global demand for IT services, strategic innovation by constituent companies, and the overall growth of the digital economy.
How can I invest in the Nifty IT index?
Investors can invest in the Nifty IT index through various financial products like index funds, exchange-traded funds (ETFs), and other investment vehicles that track the performance of the index.
Where can I find detailed information and analysis on the Nifty IT index?
Detailed information and analysis on the Nifty IT index can be found on investment platforms like the Orca app from Enrich Money.
Disclaimer: This blog is dedicated exclusively for educational purposes. Please note that the securities and investments mentioned here are provided for informative purposes only and should not be construed as recommendations. Kindly ensure thorough research prior to making any investment decisions. Participation in the securities market carries inherent risks, and it's important to carefully review all associated documents before committing to investments. Please be aware that the attainment of investment objectives is not guaranteed. It's important to note that the past performance of securities and instruments does not reliably predict future performance.