Nifty Dividend Opportunities 50 Index: A Complete Guide for Investors

Introduction
Dividend investing has long been considered a stable and rewarding strategy for investors seeking consistent income along with long-term wealth creation. To facilitate this approach, the Nifty Dividend Opportunities 50 Index was introduced, offering exposure to India’s top dividend-yielding companies while ensuring tradability and stability. This article explores the details of the index, including its methodology, sectoral spread, performance, and key constituents, before moving on to compare three stocks within it.
About the Nifty Dividend Opportunities 50 Index
The Nifty Dividend Opportunities 50 Index is designed to provide exposure to high-yielding companies listed on the National Stock Exchange (NSE). The index currently comprises 50 companies and uses a yield-driven selection methodology that balances high dividend yield with market stability.
The index was launched on March 22, 2011, with a base date of October 1, 2007, and a base value of 1000. It is calculated in real-time using the free-float market capitalization methodology. At the time of rebalancing, the weightage of any constituent is capped at 10% to avoid overconcentration risk.
Index Construction & Methodology
Selection of constituents is based on strict eligibility criteria:
-
Companies must be ranked within the top 300 companies by average free-float market capitalization and daily turnover for the last six months.
-
Companies must have traded on at least 90% of the market days over the previous six months.
-
Companies must have reported net profits as per their latest audited results.
-
Dividend yield is calculated using the last 12 months’ dividend payout, adjusted for average market capitalization.
-
The top 25 companies by dividend yield are compulsorily included, while those ranked below 75 are excluded.
-
The final list of 50 companies is prepared on the basis of higher dividend yield ranking.
Rebalancing of the index is conducted annually in March, and the capping ensures that no company exceeds a 10% weightage.
Portfolio Characteristics
This design ensures that the index remains diversified, liquid, and representative of India’s high dividend-paying companies.
-
No. of Constituents: 50
-
Calculation Frequency: Real-time
-
Index Rebalancing: Annually
-
Methodology: Periodic Capped Free Float Market Cap
Sector Representation
The index is well diversified across multiple sectors, though a few dominate significantly:
|
Sector |
Weight (%) |
|
Information Technology |
29.01 |
|
Financial Services |
21.14 |
|
Fast Moving Consumer Goods |
19.68 |
|
Oil, Gas & Consumable Fuels |
12.2 |
|
Power |
8.81 |
|
Metals & Mining |
4.05 |
|
Capital Goods |
2.47 |
|
Automobile & Auto Components |
1.85 |
|
Textiles |
0.78 |
This sectoral spread highlights the focus on both cyclical and defensive sectors, ensuring balance between stability and growth.
Performance Overview
The Nifty Dividend Opportunities 50 Index has delivered consistent returns over the long term despite short-term volatility.
|
Index Returns (%) |
QTD |
YTD |
1 Year |
5 Years |
Since Inception |
|
Price Return |
-5.19 |
-7.43 |
-15.73 |
19.1 |
10.32 |
|
Total Return |
-4.84 |
-5.74 |
-13.81 |
21.92 |
13.09 |
|
Statistics |
1 Year |
5 Years |
Since Inception |
|
Standard Deviation |
14.79 |
14.98 |
18.81 |
|
Beta (vs Nifty 50) |
1.02 |
0.9 |
0.81 |
|
Correlation (Nifty 50) |
0.9 |
0.87 |
0.9 |
|
Fundamentals |
Value |
|
P/E |
14.01 |
|
P/B |
2.71 |
|
Dividend Yield |
3.32 |
Volatility is reflected in a standard deviation of 18.81% since inception, with a correlation of 0.90 with Nifty 50, making it a relatively stable high-yield index. The fundamentals show a P/E of 14.01, P/B of 2.71, and a dividend yield of 3.32%, making it attractive for income-focused investors.
Top Constituents by Weightage
|
Company Name |
Weight (%) |
|
10.27 |
|
|
9.5 |
|
|
8.84 |
|
|
8.65 |
|
|
6.62 |
|
|
4.36 |
|
|
4.32 |
|
|
3.5 |
|
|
2.64 |
|
|
2.55 |
Breaking Down the Top Three Constituents of the Nifty Dividend Opportunities 50 Index
-
ITC Ltd.
ITC Ltd is one of the most significant constituents of the Nifty Dividend Opportunities 50 Index, supported by strong financial performance and operational efficiency. The company has significantly reduced its debt by ?1.52 crore and is virtually debt-free, reflecting a sound balance sheet. Over the past three years, it has consistently maintained a Return on Equity (ROE) of 29.05% and a Return on Capital Employed (ROCE) of 37.70%, demonstrating efficient use of capital, while its impressive interest coverage ratio of 730.82 highlights strong financial stability.
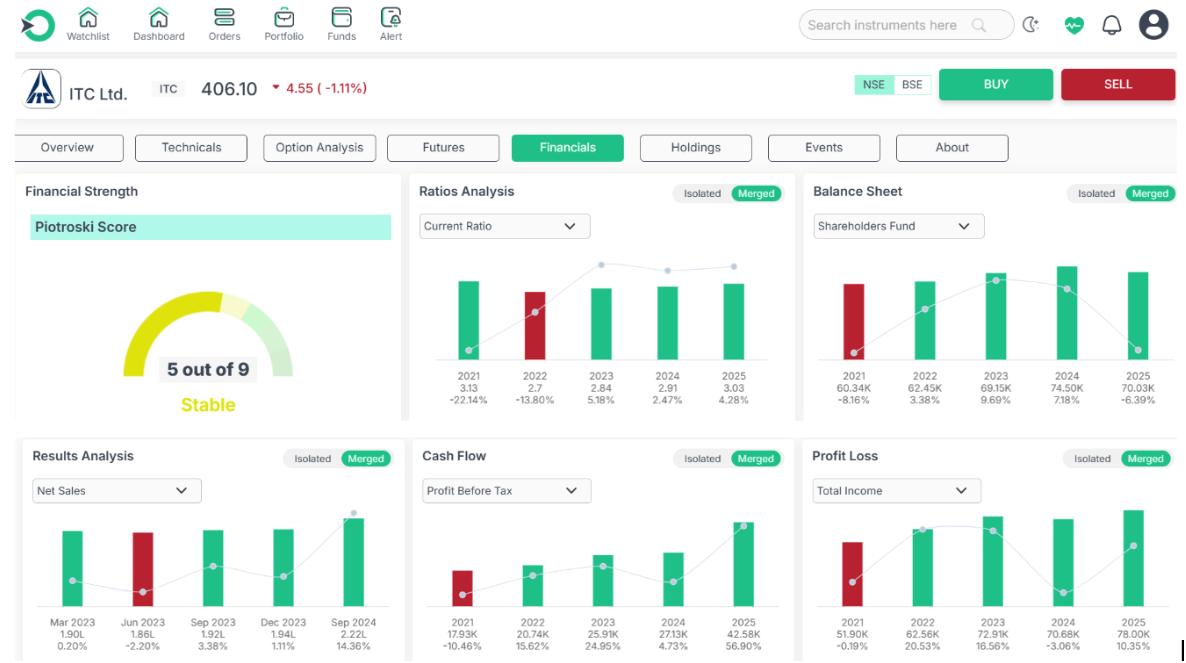
Operationally, ITC has sustained an average operating margin of 32.95% over the last five years, coupled with an efficient cash conversion cycle of 34.20 days, ensuring effective working capital management. Its current ratio of 3.03 further indicates a strong liquidity position, adding to its resilience. However, despite these strengths, the company has displayed a relatively weak revenue growth of only 7.16% over the past three years, which remains a limitation compared to faster-growing peers in the index.
-
Infosys Ltd.
Infosys Ltd is a major constituent of the Nifty Dividend Opportunities 50 Index, well-regarded for its financial strength and operational efficiency. The company is virtually debt-free, reflecting a robust balance sheet with minimal financial risk. It has consistently maintained a strong Return on Equity (ROE) of 34.02%, underscoring its ability to generate healthy returns for shareholders.
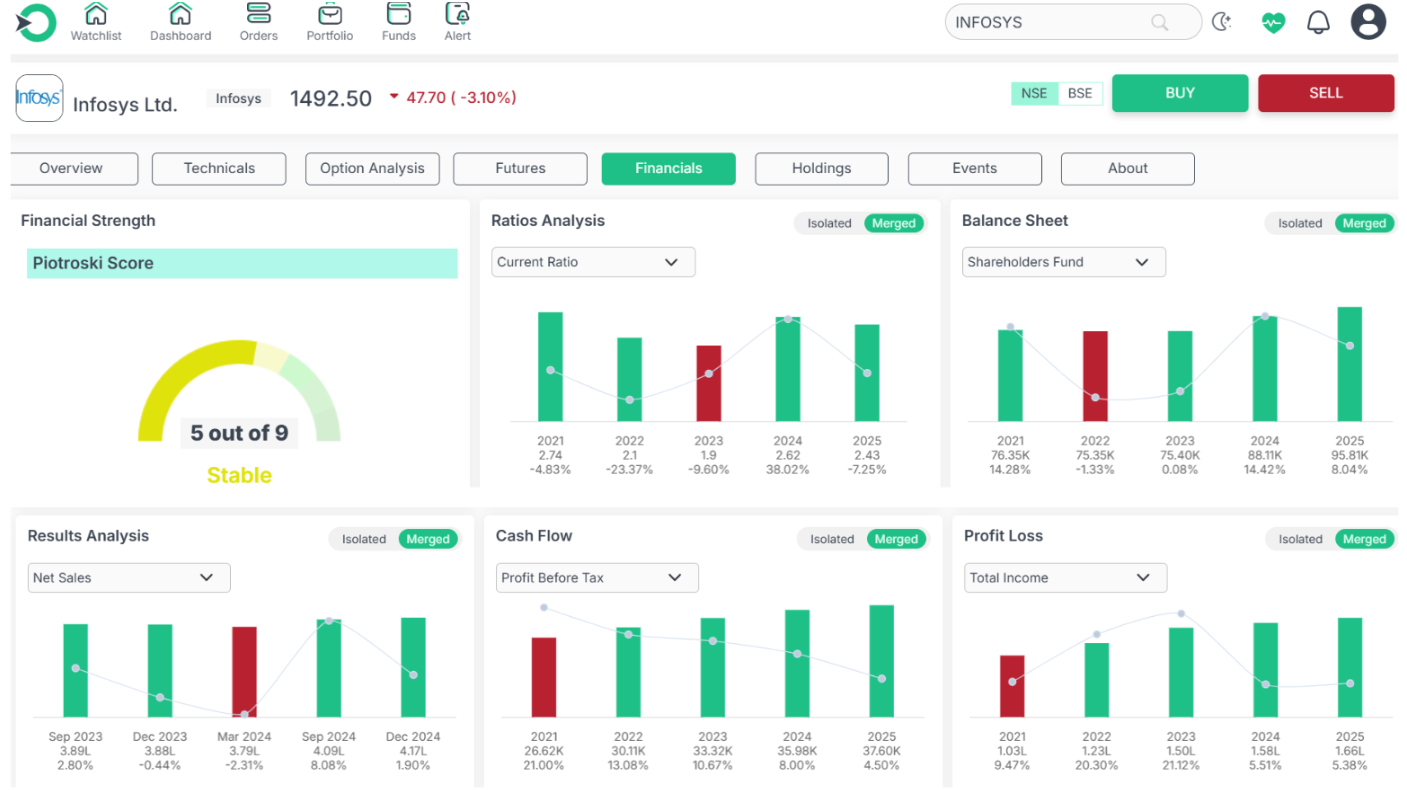
Additionally, Infosys demonstrates operational efficiency with an effective cash conversion ratio of 115.02, which highlights its capacity to efficiently convert profits into cash flows, supporting liquidity and business growth. These strengths make Infosys a reliable performer within the index, appealing to investors focused on both dividend income and long-term stability.
-
Tata Consultancy Services Ltd.
Tata Consultancy Services Ltd (TCS) is one of the top constituents of the Nifty Dividend Opportunities 50 Index, recognized for its strong financial performance and efficient operations. The company is virtually debt-free, ensuring a solid balance sheet and minimal financial risk. It has consistently maintained an exceptional Return on Equity (ROE) of 58.98%, reflecting its superior ability to generate returns for shareholders.
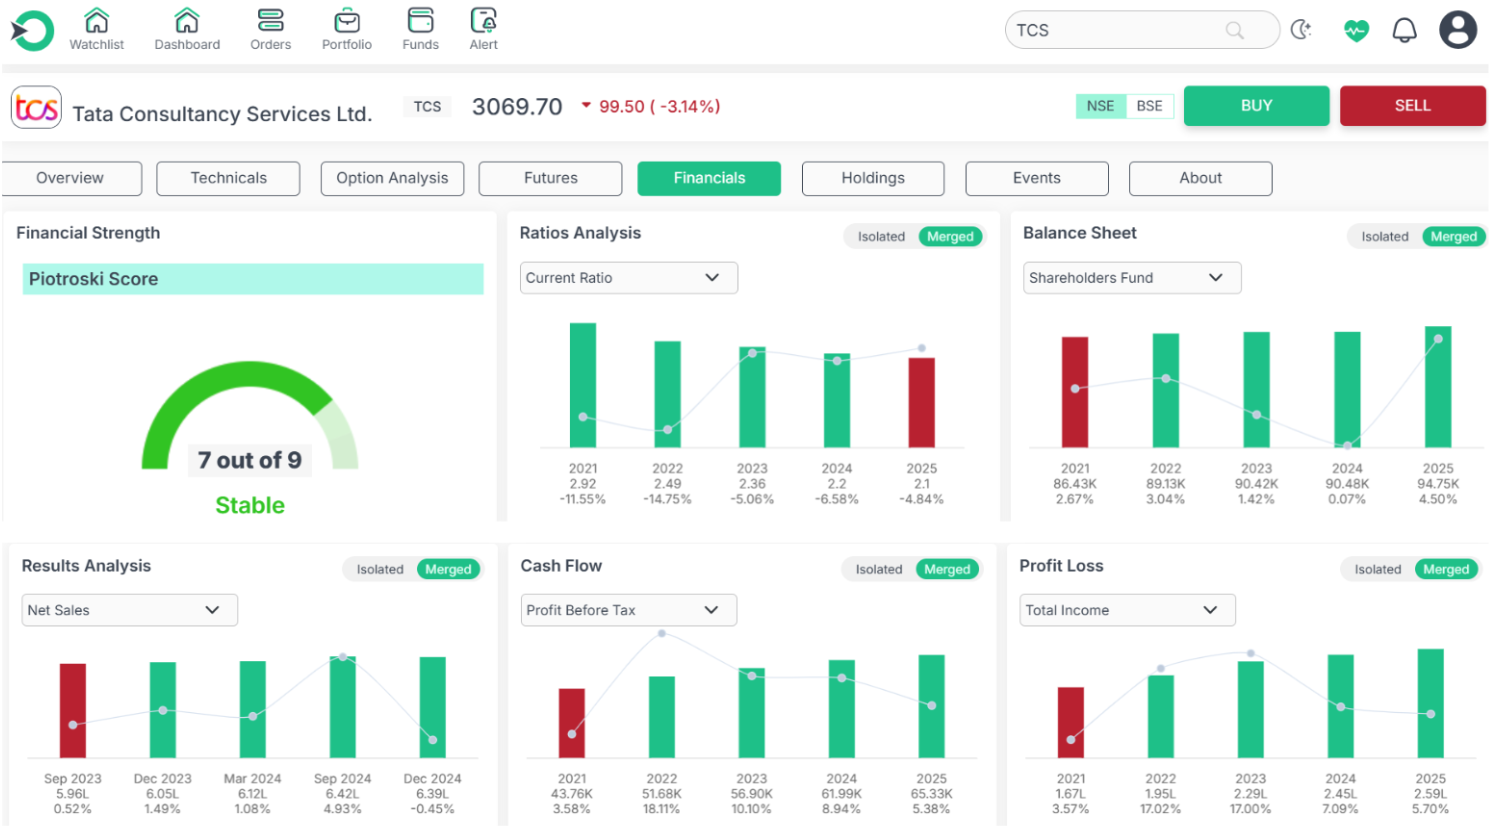
Operationally, TCS also stands out with a healthy operating margin of 26.96%, showcasing its efficiency in maintaining profitability while navigating a highly competitive global IT services market. These factors collectively strengthen TCS’s position as a leading stock within the index, offering both stability and growth potential to investors.
Comparison of Top 3 Constituents in the Nifty Dividend Opportunities 50 Index
|
Company |
Debt Position |
ROE |
Operating Margin |
Cash Conversion Cycle / Ratio |
Key Highlight |
|
ITC Ltd. |
Virtually debt-free; reduced debt by ?1.52 Cr |
29.05% (3-year avg) |
32.95% (5-year avg) |
34.20 days |
Strong liquidity with Current Ratio of 3.03 |
|
Infosys Ltd. |
Virtually debt-free |
34.02% |
Healthy margins maintained |
Cash Conversion Ratio: 115.02 |
Strong global IT presence with efficient cash utilization |
|
TCS Ltd. |
Virtually debt-free |
58.98% |
26.96% |
Robust operating efficiency |
Industry-leading profitability in IT services |
Conclusion
The Nifty Dividend Opportunities 50 Index serves as a valuable benchmark for investors seeking reliable dividend-paying companies with strong financial fundamentals. With top constituents like ITC, Infosys, and TCS leading the pack, the index balances stability, income generation, and long-term growth potential. Its diversified sectoral spread and consistent performance make it a strong choice for income-focused as well as conservative investors looking to build a resilient portfolio.
Looking to track top dividend-paying stocks like ITC, Infosys, and TCS? Enrich Money makes it simple with real-time insights and powerful portfolio tools.
Invest smarter in the Nifty Dividend Opportunities 50 Index with Enrich Money, your trusted partner for research, trading, and wealth growth.
Frequently Asked Questions
-
What is the Nifty Dividend Opportunities 50?
The Nifty Dividend Opportunities 50 represents a basket of 50 NSE-listed companies that are chosen for their ability to deliver attractive dividend yields along with long-term growth stability.
-
What is the Nifty Dividend Opportunities 50 Index Fund?
This is a fund that mirrors the Nifty Dividend Opportunities 50 Index, allowing investors to gain diversified exposure to high dividend-paying companies through a single investment.
-
How does the Nifty Dividend Opportunities 50 Index function?
The index is reviewed annually and includes companies that consistently pay dividends, have strong liquidity, and rank well in terms of market capitalization, ensuring both income and reliability.
-
What are the Nifty Dividend Opportunities 50 Stocks?
These are the individual companies that form part of the index. Each stock is selected for its history of paying dividends and maintaining financial strength.
-
Where can I get the Nifty Dividend Opportunities 50 Stocks List?
The complete and updated list is available on the NSE’s official website and through trusted financial research platforms that track index constituents.
-
What does the Nifty Dividend Opportunities 50 Factsheet provide?
The factsheet offers investors a detailed view of the index, including sector allocation, performance history, valuation ratios, and dividend yield data to support informed decisions.
Disclaimer: This blog is dedicated exclusively for educational purposes. Please note that the securities and investments mentioned here are provided for informative purposes only and should not be construed as recommendations. Kindly ensure thorough research prior to making any investment decisions. Participation in the securities market carries inherent risks, and it's important to carefully review all associated documents before committing to investments. Please be aware that the attainment of investment objectives is not guaranteed. It's important to note that the past performance of securities and instruments does not reliably predict future performance.