Mean Reversion Strategy in Algorithmic Trading

Introduction to Mean Reversion
Mean Reversion is one of the popular algorithmic trading strategies in which the stock price will revert to its historical stock price average or mean value. It is used to detect deviations of a stock's price from its average or mean stock price. Traders take advantage over these average stock price deviations and make profit.
Underlying Concept of Mean Reversion Strategy
Mean Reversion strategy works on the concept that when the stock price deviation is more from its mean stock price, then the stock price will revert back to its mean stock price eventually. The deviation from mean stock price is the opportunity that can be utilized by the trader.
Components of Mean Reversion Strategy
Identify the Mean using Key Indicators
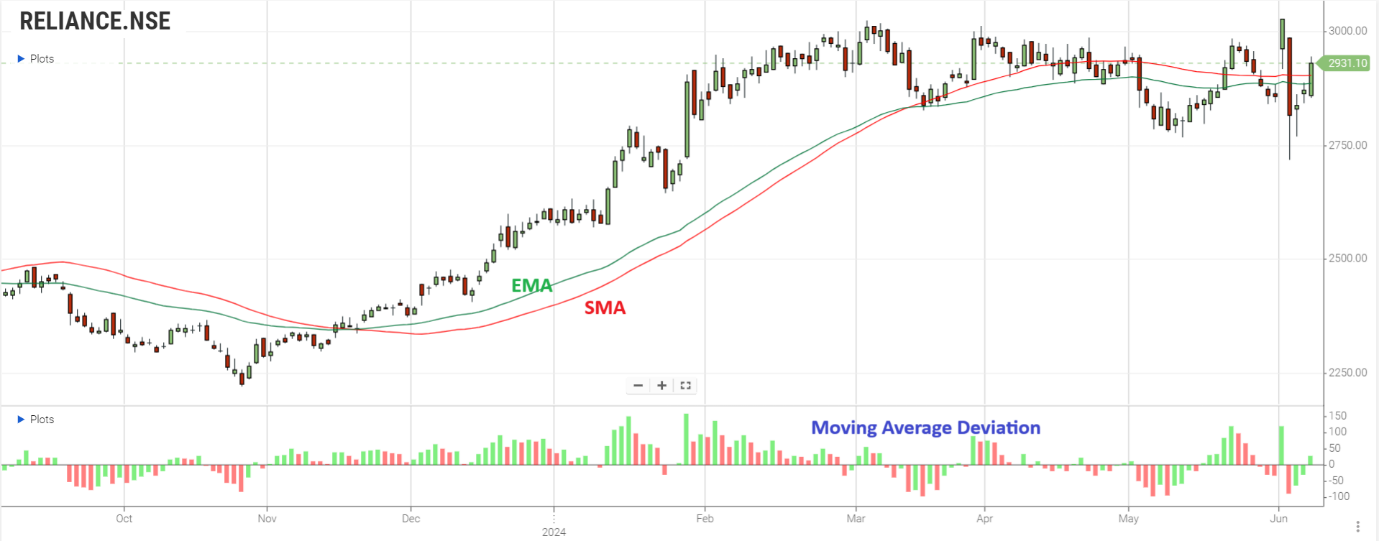
Moving Averages: Mean stock price can be identified using simple moving average or exponential moving average .

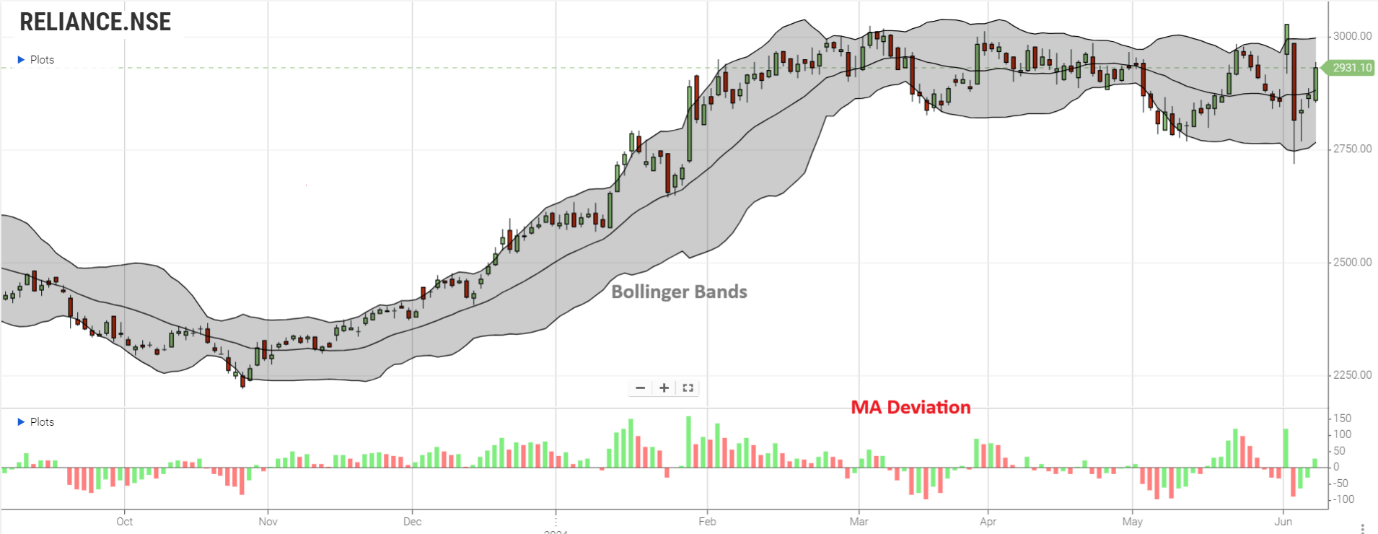
Bollinger Bands: Mean stock price can also be identified using Bollinger Banks which uses two standard deviation lines above and below the stock price, to indicate overbought and oversold conditions.

Entry and Exit Signals:
Strategy 1: Using Standard Deviation
Entry:
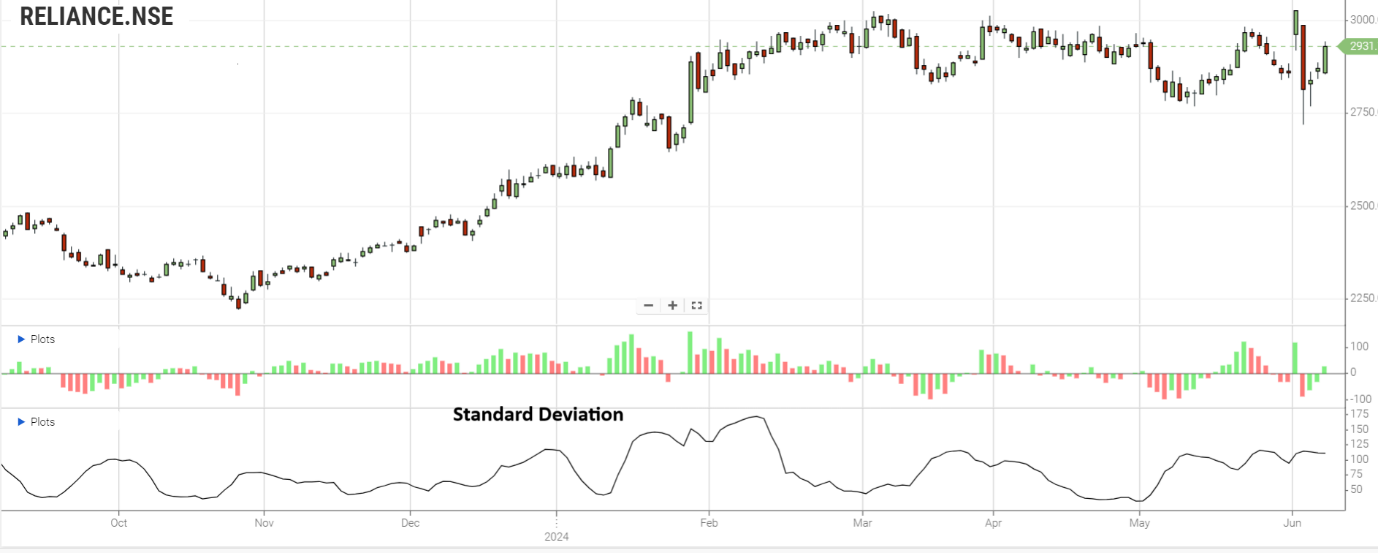
When the stock price is below a standard deviation of the mean , it indicates stock is oversold, traders can take a long position, and when the stock price is above a standard deviation of the mean , it indicates stock is overbought, traders can take a short position.
Exit: Trader can make profit by closing his position when the stock price returns to the mean stock price.
Strategy 2: Using Moving Average Deviation
Entry: Trader can take a long position when the stock price deviation from mean reversion is too less and take a short position when the stock price deviation from the mean reversion to more.
Exit: Trader can make profit by closing his position when the stock price returns to the mean stock price.
Identifying Deviation:
Standard Deviation: It indicates the stock price deviation from the mean stock.

Z-Scores: Z scores calculate the number of standard deviations from the mean stock price.
Implementing the Mean Reversion Strategy in Algorithmic Trading
Data Collection
Historical stock price is used to calculate average or mean stock price and stock price deviation.
Algorithm Development:
Coding: Algorithms are coded to automatically make opportunity of mean reversion strategy and execute trades.
Backtesting: The algorithm is tested against historical data to evaluate its performance and refine parameters.
Execution:
Trading Platforms: The algorithm is deployed on a trading platform that can execute trades automatically based on traders input criteria.
Monitoring and Adjustment: Continuous monitoring is required to ensure the algorithm performs as expected and adjusts to market conditions.
Risk Management
-
Stop-Loss Orders: Trader creates stop-loss order to limit his potential losses when the stock price fluctuates unexpectedly.
-
Position Sizing: Trader must ensure that each trade position taken by him does not affect any other trades in his portfolio.
-
Diversification: Trader must use strategy to reduce his risk by diversifying his asset classes.
Advantages and Disadvantages
Advantages:
-
Predictability: Historical stock price implies to the trader that the stock prices revert to its mean stock price, making this strategy relatively predictable.
-
Frequency of Trades: Mean Reversion strategy creates trading opportunities in both volatile and stable markets to enable traders to make profit frequently.
Disadvantages:
-
Market Changes: Due to market fluctuations, mean reversion strategy using the historical stock price may no longer be relevant.whi
-
Risk of Non-Reversion: Stock prices may not revert to their mean stock price within the expected time frame, which might lead to potential losses.
Conclusion
Mean reversion strategies are widely used in hedge funds and trading firms. They are particularly effective in markets with clear cycles or regular price fluctuations. For instance, pairs trading, where two correlated stocks are traded based on their relative deviations from the mean, is a popular application of mean reversion.
In the Indian stock market, this strategy can be applied to indices like Nifty and Sensex, as well as individual stocks, by leveraging the availability of historical data and advanced trading platforms.
By automating mean reversion strategies through algorithmic trading, traders can efficiently capitalize on price deviations, reduce emotional trading biases, and enhance their overall trading performance.
Frequently Asked Questions
What is a mean reversion strategy?
A mean reversion strategy assumes that asset prices will return to their historical average. It involves buying undervalued assets and selling overvalued ones.
How do you determine the mean in mean reversion?
The mean is typically calculated using moving averages. Commonly used averages include the simple moving average and the exponential moving average .
What are the indicators used in mean reversion strategy?
Key indicators include moving averages, Bollinger Bands, RSI, and standard deviation. These help identify overbought or oversold conditions.
What are the risks of using mean reversion strategies?
Risks include market changes that affect the mean, non-reversion of prices, and execution errors. Proper risk management is crucial to mitigate these risks.
How do you implement a mean reversion strategy? Implementation involves coding the strategy, backtesting it with historical data, and deploying it on a trading platform. Continuous monitoring and adjustment are essential.
