Investment Opportunities in Nifty Commodities: A Stock Comparison

Commodities Sector in India
The commodities sector includes various commodities like precious metals, industrial metals, energy producing products and agricultural goods.
Commodity sector in India is expected to achieve a nominal value of INR 82.90 trillion in 2024 while the commodity nominal value of the United States is of INR 3794 trillion, thus ranking first on the basis of nominal value.
By 2028, Indian Commodities Sector is expected to achieve an INR 87.87 trillion, with a compounded annual growth rate of 1.42% from 2024 to 2028.
In 2024, Indian Commodities contract price is INR 0.46 on an average as of 2024. It is expected that the Indian Commodities contract size would reach around 181.8 million by 2028.
Currently , Global and domestic investors are looking out for ways to create a diversified portfolio and for potential hedging strategies during market uncertainties.
Based on the current exchange rate, the countries which rank among the first five on the basis of nominal value in commodities sectors are the United States, China, South Africa, Japan and France.
Transformations in India's Commodities Market"
The Indian commodities market has undergone significant transformations in recent years in terms of customer's interest, market trends, domestic factors, domestic macroeconomic drivers etc...
Customer's Interest :
Customers are more interested to invest in commodities for a diversified portfolio to safeguard from market fluctuations. The increased usage of trading platforms and financial awareness among investors have encouraged investors to invest in commodities. Investors can seek expert guidance , sound financial knowledge from resource centers and trade using reliable trading platforms from Enrich Money.
Market Trends :
The stock market has identified a notable trend among investors is the rise in commodity market investment by retail investors. The factors which drive these market trends are online trading platforms which makes retail investors more accessible to stock market trading and investments.
Domestic Factors :
India's commodities market is influenced by the agricultural sector. The monsoon patterns, government policies and global demand for agricultural goods directly influence the Indian commodity sector prices. Investors closely monitor these factors to analyse and decide upon their investment.
Macroeconomic Factors :
As India continues in its path of urbanization and industrialization, the demand for energy, metals and agricultural goods is expected to increase tremendously. Also, the GoI initiatives to boost infrastructure and manufacturing sector, further increases the demand for commodities within the market.
Nifty Commodities Index
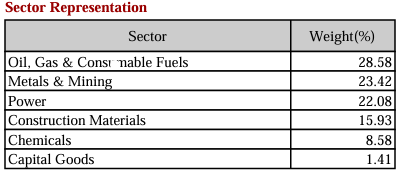
Nifty Commodities Index represents the performance of commodities sector companies from oil, gas and consumable fuels, power, metals and mining , construction materials, chemicals and capital goods.
Nifty Commodities Index consists of 30 NSE listed stocks. This index serves as a benchmark for launch of new portfolio funds, index funds , exchange traded funds and structured products.
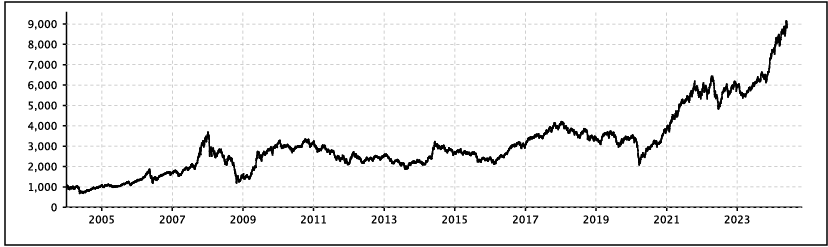
Nifty Commodities Index was launched on 7th September, 2011 with base date of 1st January, 2004 and value 1000.
Nifty Commodities Index is rebalanced on a half yearly basis . Mean of Six-month data is considered for rebalancing .
At times of index rebalancing, reconstitution or investable weight factors (IWFs) , the constituent stock weightage is capped at 10% .
How Nifty Commodities Index Stocks are selected ?
Eligible companies are chosen based on the average daily turnover and daily full market capitalization, using data from the Nifty 500 index rebalancing.
At time of Nifty Commodities Index review, the constituent companies should be part of Nifty 500 index.
If the Nifty Commodities eligible companies in Nifty 500 is less than , then the remaining companies will be selected from NSE listed top 800 companies.
Nifty Commodities constituent companies should be from commodities sector.
The company selected for Nifty Commodities index should have a trading frequency of minimum 90% in the past six months.
The eligible company should be listed on NSE for a period of minimum one month as on cutoff date.
The final selection of 30 eligible Nifty Commodities Index companies will be based on the free float market capitalization method of the companies.
|
Company Name |
Industry |
|
ACC Ltd. |
Construction Materials |
|
APL Apollo Tubes Ltd. |
Capital Goods |
|
Adani Energy Solutions Ltd. |
Power |
|
Adani Green Energy Ltd. |
Power |
|
Adani Power Ltd. |
Power |
|
Ambuja Cements Ltd. |
Construction Materials |
|
Bharat Petroleum Corporation Ltd. |
Oil Gas & Consumable Fuels |
|
Coal India Ltd. |
Oil Gas & Consumable Fuels |
|
Dalmia Bharat Ltd. |
Construction Materials |
|
Deepak Nitrite Ltd. |
Chemicals |
|
Grasim Industries Ltd. |
Construction Materials |
|
Hindalco Industries Ltd. |
Metals & Mining |
|
Hindustan Petroleum Corporation Ltd. |
Oil Gas & Consumable Fuels |
|
Indian Oil Corporation Ltd. |
Oil Gas & Consumable Fuels |
|
JSW Steel Ltd. |
Metals & Mining |
|
Jindal Steel & Power Ltd. |
Metals & Mining |
|
NTPC Ltd. |
Power |
|
Oil & Natural Gas Corporation Ltd. |
Oil Gas & Consumable Fuels |
|
PI Industries Ltd. |
Chemicals |
|
Pidilite Industries Ltd. |
Chemicals |
|
Reliance Industries Ltd. |
Oil Gas & Consumable Fuels |
|
SRF Ltd. |
Chemicals |
|
Shree Cement Ltd. |
Construction Materials |
|
Steel Authority of India Ltd. |
Metals & Mining |
|
Tata Chemicals Ltd. |
Chemicals |
|
Tata Power Co. Ltd. |
Power |
|
Tata Steel Ltd. |
Metals & Mining |
|
UPL Ltd. |
Chemicals |
|
UltraTech Cement Ltd. |
Construction Materials |
|
Vedanta Ltd. |
Metals & Mining |
Sectoral Weightage of Nifty Commodities Index
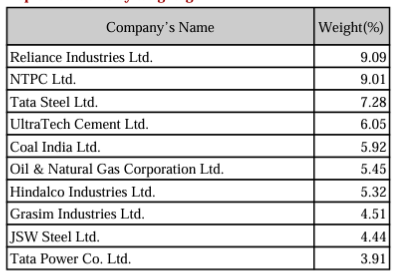
Leading Constituents of Nifty Commodities Index
Performance metrics of the Nifty Commodities Index
Nifty Commodities Index renders a dividend yield of 1.58. The price earnings ratio is at 16.89 and price to book ratio is at 2.6
Nifty Commodities Index renders a CAGR price return of 13.34% since inception. For a period of 5 years, the CAGR price return of the index is 19.25% . For a period of a year , the price return is 52.01% and the YTD, price return value is 15.16%.
The correlation between Nifty 50 and Nifty Commodities Index stands at 0.9o since its launch.
Source : niftyindices.com
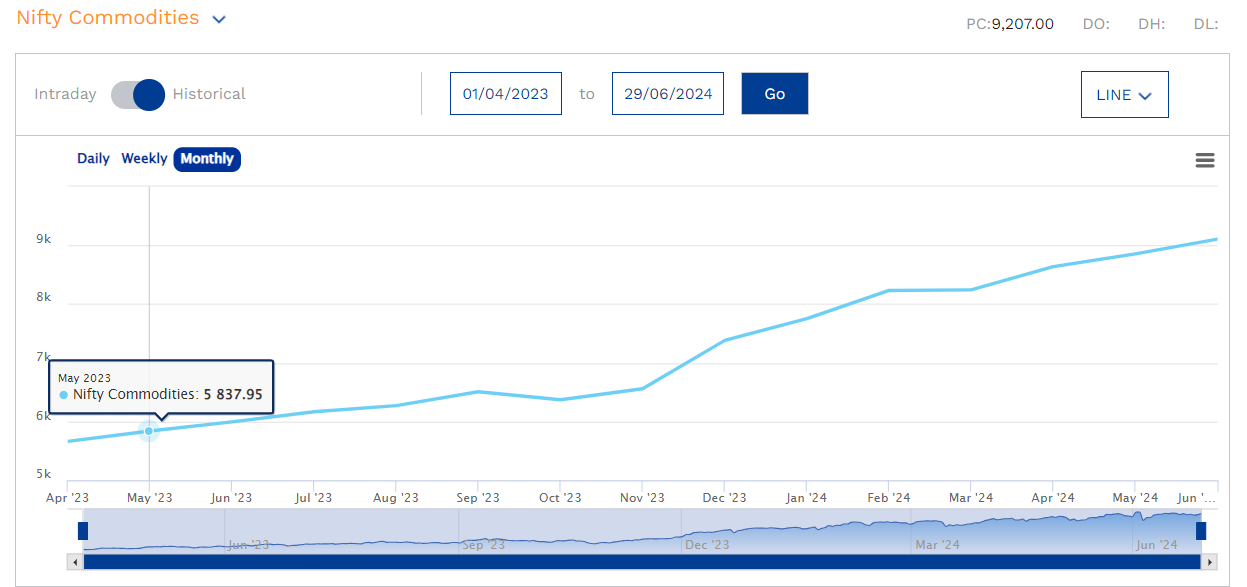
Historical Price Analysis of Nifty Commodities Index
Nifty Commodities Index Stock Comparison
To analyze the Nifty Commodities index stocks, let’s consider three of the Nifty Commodities Index stocks for comparative analysis.
Explore Enrich Money's digital investing platform and seize control of your financial future. Open a free demat trading account today with Enrich Money, your trusted partner in wealth tech management.
Let’s analyze three of the Nifty Commodities Stocks for comparative analysis.
Intraday Price Comparative Analysis
|
Stock Name (as of 29thJune, 2024) |
Reliance Industries Limited |
NTPC Limited |
Tata Steel Limited |
|
Open (INR) |
Rs.3128.25 |
Rs.362 |
Rs.179 |
|
High (INR) |
Rs.3400 |
Rs.363 |
Rs.180 |
|
Low (INR) |
Rs.2954 |
Rs.362 |
Rs.172 |
|
Last Traded Price (INR) |
Rs.3127.15 |
Rs.362 |
Rs.172.45 |
|
Volume |
13930 |
10800 |
10870 |
|
Previous Close (INR) |
Rs3127.15 |
Rs.378.35 |
Rs.172.45 |
On basis of intraday price analysis, the NTPC Limited and Tata Steel stocks have traded closer to intraday high .
Monthly Price Comparative Analysis
|
Stock Name |
Reliance Industries Limited |
NTPC Limited |
Tata Steel Limited |
|
Date |
Closing Price in INR |
||
|
Jun 28, 2024 |
3,130.80 |
378.35 |
174.01 |
|
Jun 1, 2024 |
3,130.80 |
378.35 |
174.01 |
|
May 1, 2024 |
2,860.80 |
359 |
167.2 |
|
Apr 1, 2024 |
2,934.00 |
363.2 |
165 |
|
Mar 1, 2024 |
2,971.70 |
335.8 |
155.85 |
|
Feb 1, 2024 |
2,921.60 |
335.6 |
140.85 |
|
Jan 1, 2024 |
2,853.25 |
317.5 |
135.95 |
|
Dec 1, 2023 |
2,584.95 |
311.15 |
139.6 |
|
Nov 1, 2023 |
2,377.45 |
261.3 |
127.9 |
|
Oct 1, 2023 |
2,287.90 |
235.8 |
118.75 |
|
Sep 1, 2023 |
2,345.00 |
245.55 |
128.9 |
|
Aug 1, 2023 |
2,407.00 |
220.3 |
122.9 |
|
Jul 1, 2023 |
2,549.25 |
218.35 |
123.15 |
While observing the monthly stock price data, the stock price of all the three stocks is in uptrend.
Chart Analysis
Reliance Industries Limited
Reliance Industries Limited, a major player in India's corporate business, operates in a diverse range of business from energy, petrochemicals, retail to telecommunications. Founder of Reliance Industries Limited was Mr. Dhirubhai Ambani. The company is a global leader in the market with its innovation, consistency, tremendous growth etc... Reliance Industries Limited is one of the crucial players in the Indian economy.
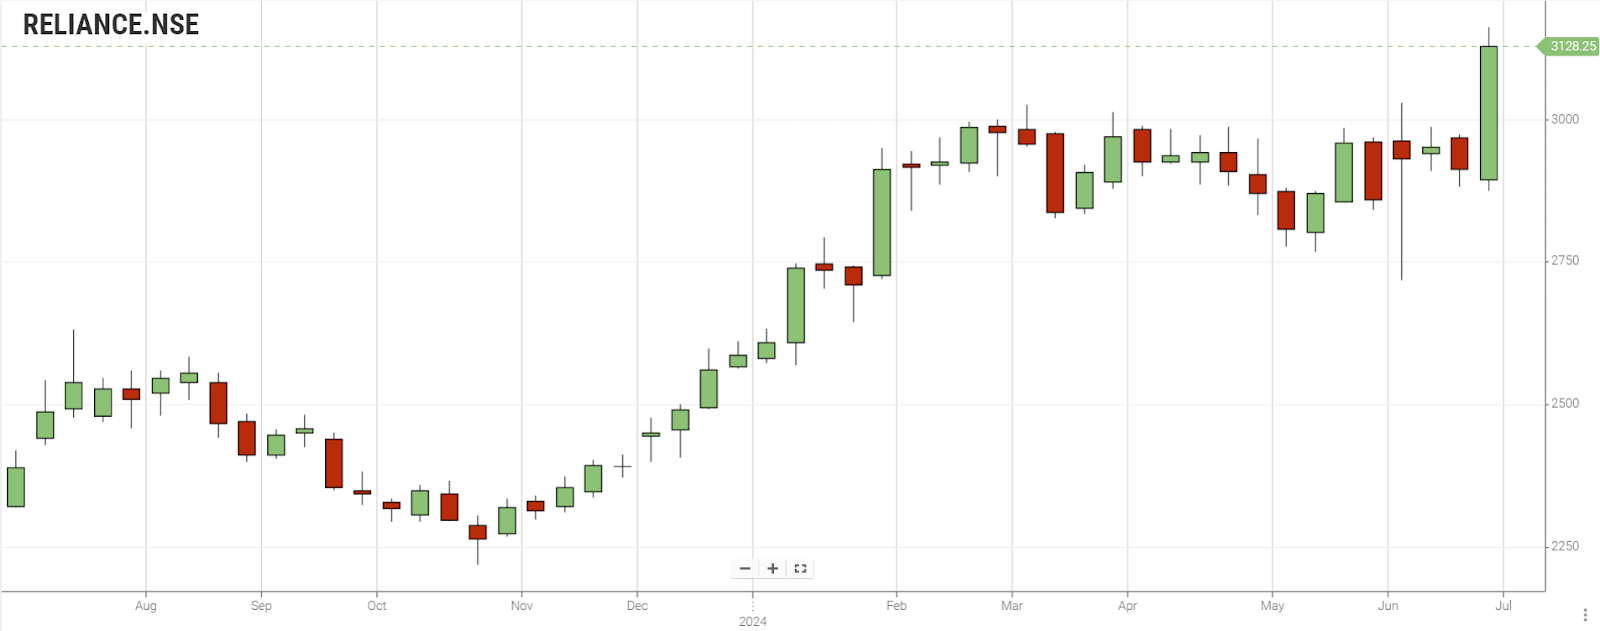
The Bullish Continuation Heikin Ashi Pattern is observed on daily charts. Strong bullish Heikin Ashi pattern is observed with high volume on weekly and monthly price charts.
NTPC Limited
NTPC Limited, India's major power generation company in India, NTPC Limited founded in the year 1975, operates in diverse power generation business in the form of conventional and renewable energy resources. NTPC Limited plays a crucial role in India's economic growth and future.
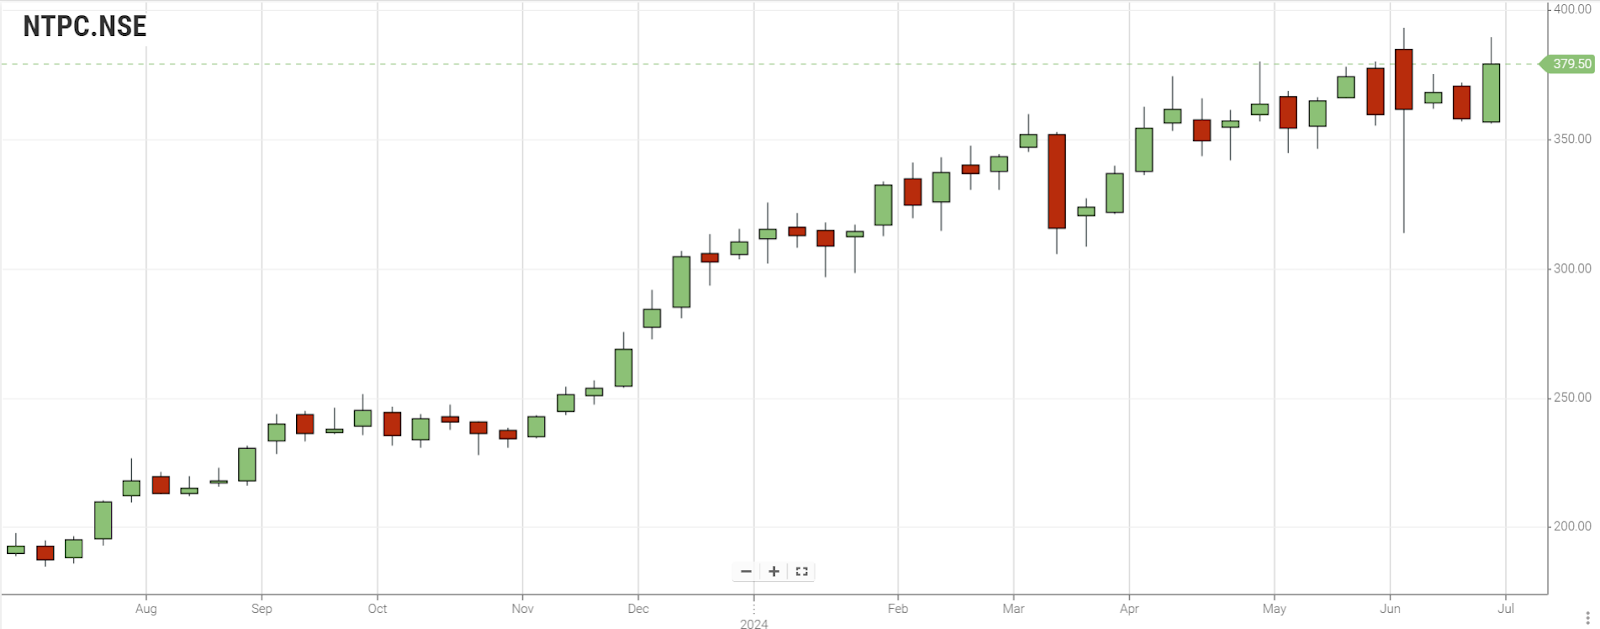
The Bullish Continuation Heikin Ashi pattern is formed on daily charts. The Bullish Heikin Ashi pattern from tick red to green is formed on weekly charts. Bullish Heikin Ashi pattern is observed with high volume on monthly price data.
Tata Steel Limited
Tata Steel Limited, a global leader in the steel industry was established in 1907 .Tata Steel produces high quality steel with its strong industrial expertise and innovation.
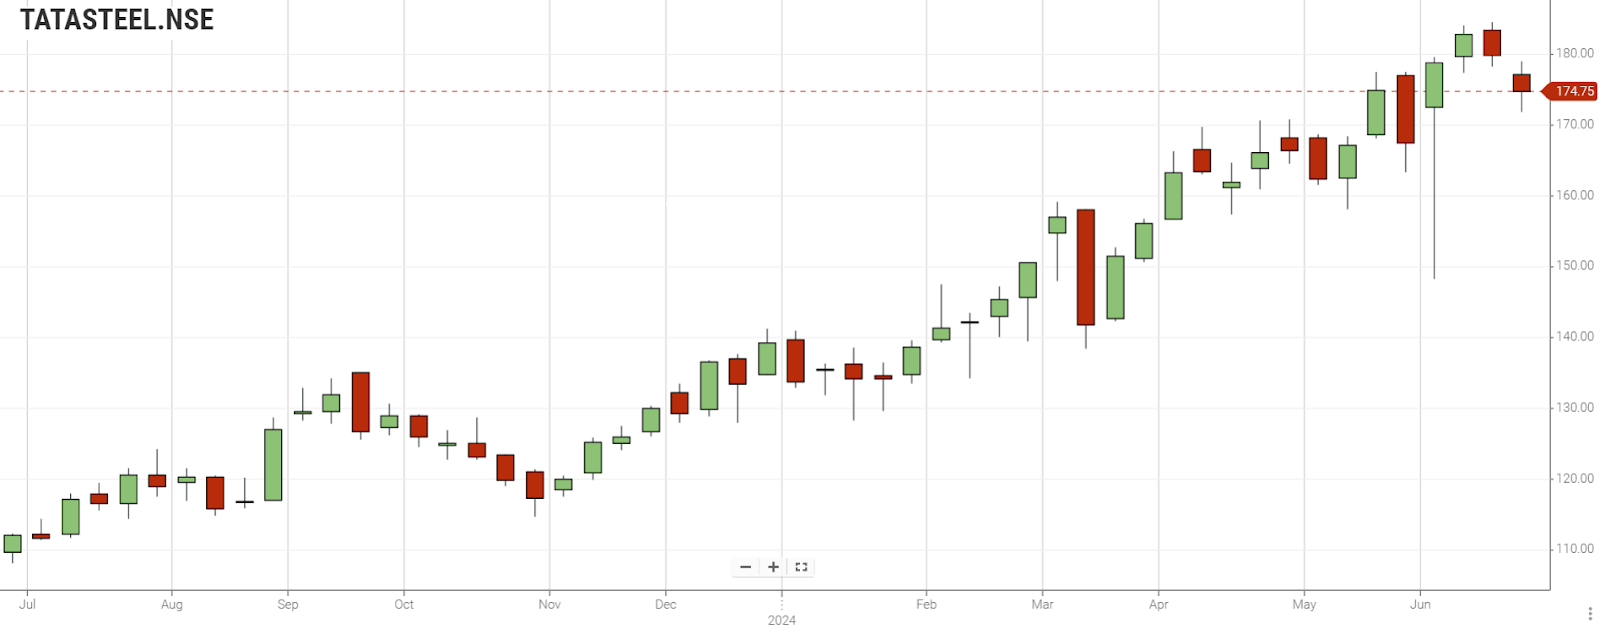
Doji Heikin Ashi Pattern is formed with neutral signals on daily charts. Bearish Heikin Ashi pattern with high volume is formed on weekly charts. Bullish continuation Heikin Ashi Pattern is formed on monthly charts.
Fundamental Analysis
Reliance Industries Limited
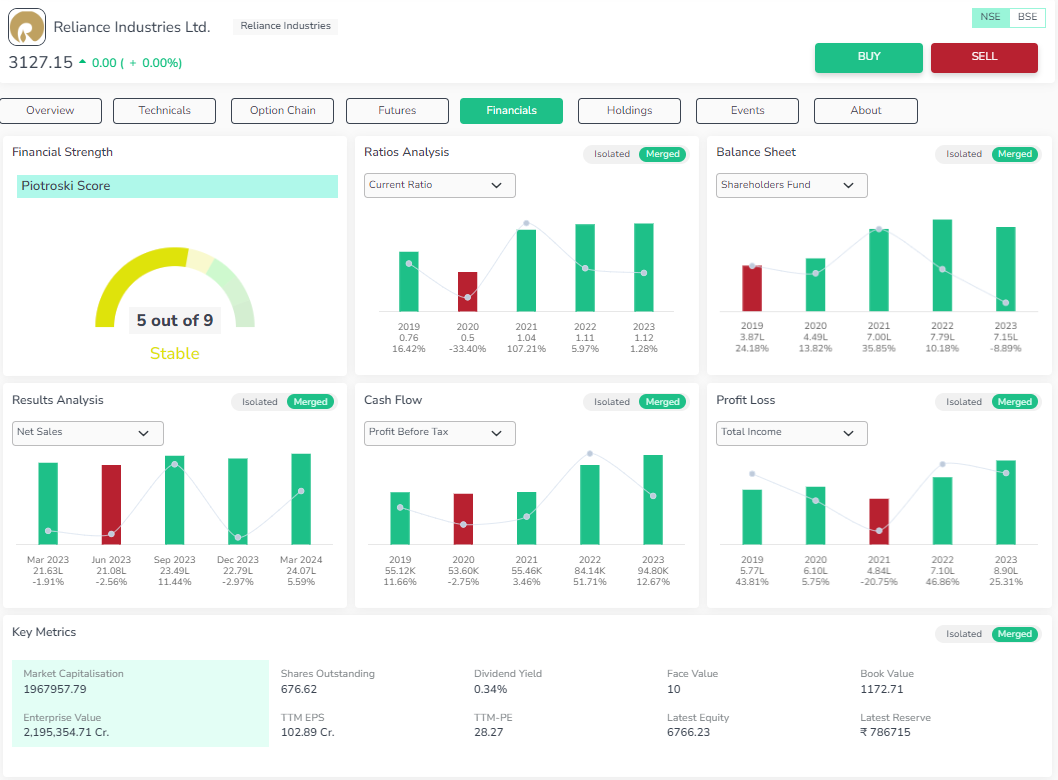
Valuation – On analysis of the price to intrinsic value , the stocks are undervalued, which is a good signal for the investors to invest in the stock. But the shareholder’s return value and book value of the stock are in downtrend for the past three years.
Profitability – The stocks annual net profit, PBT, EPS are in uptrend on YoY and QoQ basis. But the stocks yielding in dividend and earnings are too low . Also, the stock has provided low Return on Assets.
Growth – The company’s sales and total asset value has increased in the past three years.
Stability – The company has low book debts but the company needs to enhance its cash liquidity .
NTPC Limited
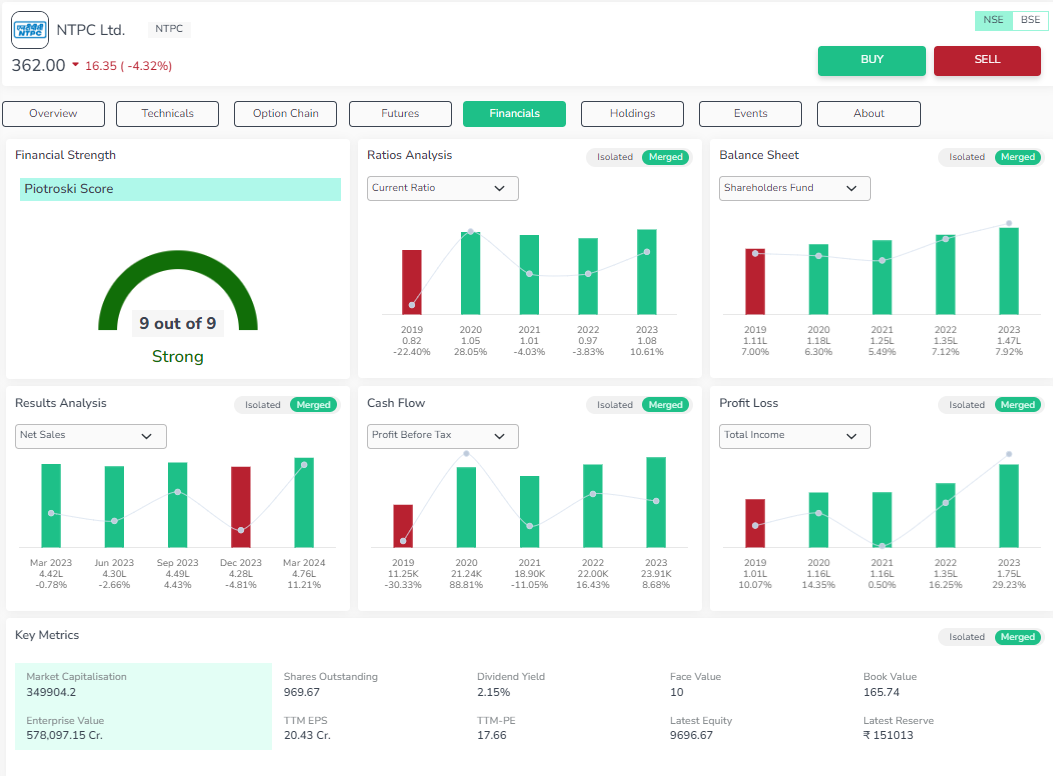
Valuation – The price to intrinsic value indicates that the stocks are undervalued and the book value of the stock is in uptrend.
Profitability – The stock’s EPS , dividend yield, net profit, EBITDA, RoE and net margin indicates excellent profitability on YoY basis. The company needs to improve its earnings yielding power and Return on assets.
Growth – The sale of the company over a period of last three years is in uptrend.
Stability - The company has reduced its debt in the past five years. Also, the company’s liquidity has also improved.
Tata Steel Limited
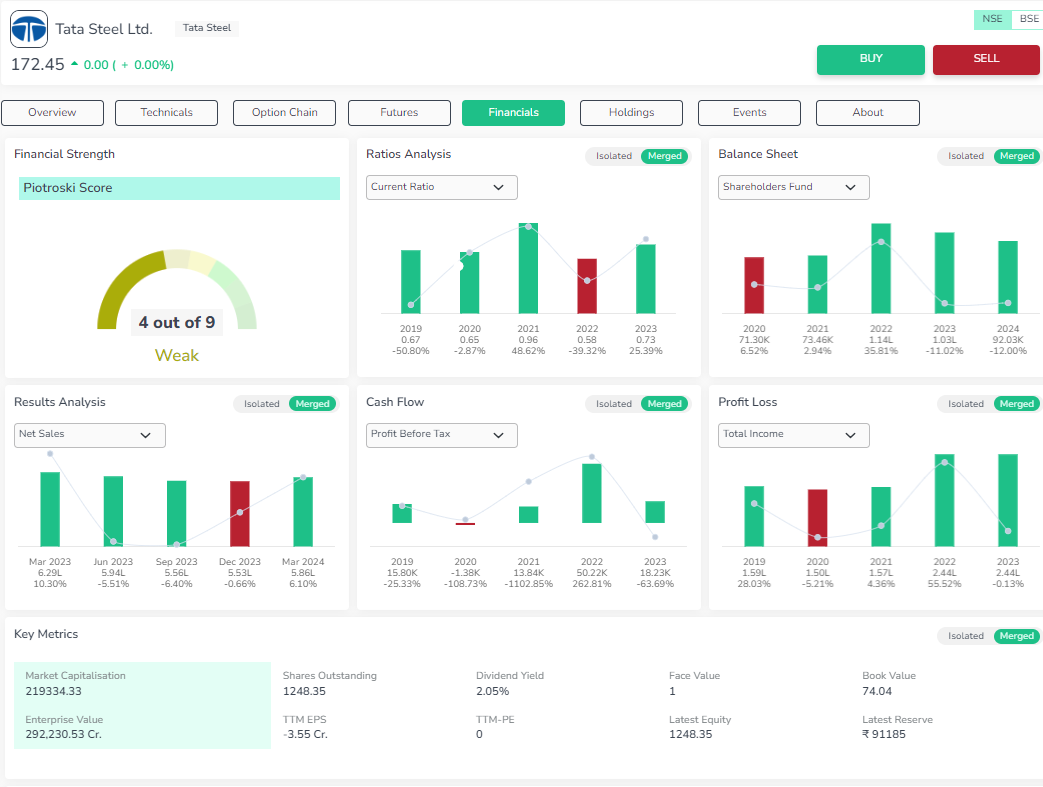
Valuation – The book value of the stock is in downtrend. The price to intrinsic value of the stock indicates that it is undervalued, which is preferable for investors.
Profitability – The stock’s profitability ratios like RoE, RoA, Net profit and operating margin are negative, which indicates that the stocks profitability is very poor.
Growth – The company’s operating cash flows are negative over a period of three years.
Stability - The stock’s revenue is in downtrend while the debt of the company is in uptrend, which indicates that the company is not able to generate cash for its operations.
Technical Analysis
Unlock in-depth insights into stock performance with the Orca app. Access detailed technical and fundamental analysis instantly. Download today!
|
Technical Analysis @ 29.06.2024 |
|||
|
Stock Name |
Reliance Industries Limited |
NTPC Limited |
Tata Steel Limited |
|
Moving Averages |
|||
|
SMA 20 Days |
2883.37 |
356.88 |
165.94 |
|
EMA 20 Days |
2868.04 |
355.52 |
164.57 |
|
SMA 200 Days |
2627.13 |
287.09 |
136.54 |
|
EMA 200 Days |
2666.56 |
292.46 |
139.32 |
|
Indicators |
|||
|
RSI |
43.59 |
54.66 |
53.15 |
|
CCI |
-58.11 |
59.58 |
25.5 |
|
WILLIAMS_R |
-50.1 |
-43.53 |
-56.22 |
|
UO |
50.75 |
52.52 |
48.93 |
|
Rate of Change |
-3.62 |
-2.01 |
-1.04 |
|
MACD |
-29.96 |
1.67 |
1.28 |
|
ADX |
0 |
0 |
0 |
|
Standard Pivot Levels |
|||
|
R4 |
2844.1 |
363.5 |
166.95 |
|
R3 |
2840.15 |
362.97 |
166.65 |
|
R2 |
2836.2 |
362.43 |
166.35 |
|
R1 |
2833.95 |
361.97 |
166.1 |
|
Pivot |
2830 |
361.43 |
165.8 |
|
S1 |
2827.75 |
360.97 |
165.55 |
|
S2 |
2828.3 |
361.37 |
165.75 |
|
S3 |
2821.55 |
389.97 |
165 |
|
S4 |
2819.3 |
359.5 |
164.75 |
Reliance Industries Limited
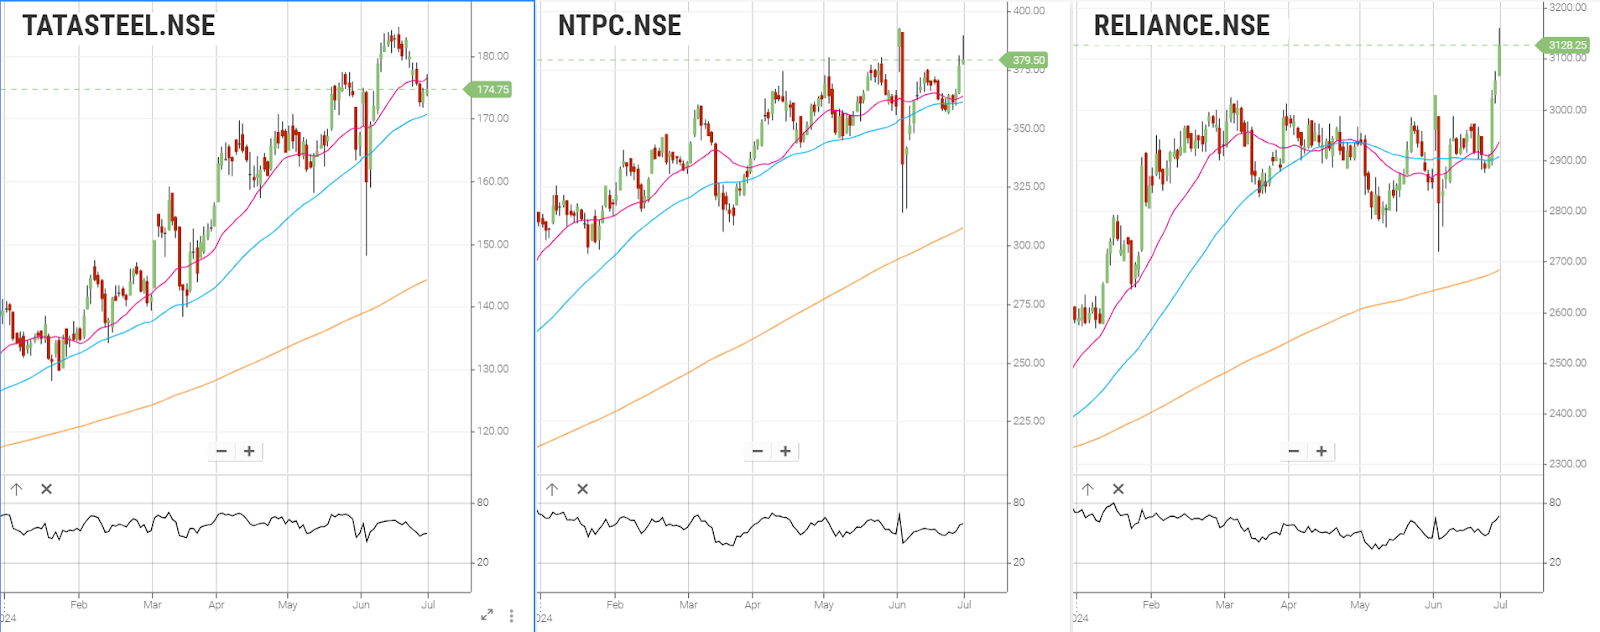
SMA and EMA levels indicate that stock exhibits bullish signals. The technical indicators imply that the stocks would exhibit neutral signals.
NTPC Limited
SMA and EMA levels indicate that stock exhibits strong bearish signals. The technical indicators imply that the stocks would be neutral.
Tata Steel Limited
SMA and EMA levels indicate that stock exhibits bearish signals. The technical indicators imply that the stocks would follow a neutral pattern.
The below chart exhibits the comparative technical study of three Nifty Commodities Index stocks based on Moving average crossover signals and Relative strength index for a period of 6 months.
Conclusion
The Indian Commodities sector is positioned for significant growth, with projections indicating a rise to Rs. 87.87 trillion by 2028. Nifty Commodities Index constituting key market players like Reliance Industries, NTPC Limited and Tata Steel Limited serves as a significant benchmark for investors. This comparative analysis highlights the various factors influencing commodities market like customer’s interest, market trends and macroeconomic drivers.
By leveraging tools like Enrich Money’s Orca app, investors can access detailed technical and fundamental insights, ensuring well-informed decisions. As the market evolves, staying updated with comprehensive analysis will be key to maximizing investment opportunities.
Frequently Asked Questions
How are stocks of the Nifty Commodities Index selected?
Stocks are selected based on the mean daily turnover and market capitalization data of Nifty 500 index rebalancing.
How often is the Nifty Commodities Index rebalanced?
The Nifty Commodities Index is rebalanced on a half yearly basis by considering the mean of six-month data .
What is the importance of the Nifty Commodities Index for investors?
The Nifty Commodities Index serves as a benchmark for launching portfolio funds, index funds, ETFs, and structured products, helping investors gauge sector performance.
Which sectors are included in the Nifty Commodities Index?
Nifty Commodities Index represents companies from oil, gas and consumable fuels, power, metals and mining , construction materials, chemicals and capital goods.
How can one invest in the Nifty Commodities Index and its stocks?
You can invest in Nifty Commodities stocks through a reliable stockbroker like Enrich Money or trading platforms like Orca . It's important to conduct thorough research or consult with a financial advisor to understand the risks and benefits associated with these investments.
Related Stocks:
HDFC Asset Management Company Ltd.
Nippon Life India Asset Management Ltd.
Disclaimer: This blog is dedicated exclusively for educational purposes. Please note that the securities and investments mentioned here are provided for informative purposes only and should not be construed as recommendations. Kindly ensure thorough research prior to making any investment decisions. Participation in the securities market carries inherent risks, and it's important to carefully review all associated documents before committing to investments. Please be aware that the attainment of investment objectives is not guaranteed. It's important to note that the past performance of securities and instruments does not reliably predict future performance.