Nifty PSU Bank Stock Comparison

Indian Banking Industry
The banking industry in India with its presence of about 123,000 bank branches with 252,000 ATM's. The Indian Banking industry is stable with USD 2 trillion deposits, low non-performing assets, stringent maintenance of capital adequacy and liquidity factors stands out as a robust and well capitalized financial banking system in India. The GoI has taken immense measures to make the banking system accessible to every village in India within a radius of 5 km .
The GoI has taken numerous measures such as KYC process, Digi locker, credit guarantee scheme for MSMEs, central repository of financial and allied information. savings schemes for women and senior citizens.
Indian Banking System Outlook
It is forecasted that India will become the third largest consumer economy in the next five years. The increase in younger population under the age group of below 35 years is almost 65% of total population in India. Thus , this large consumption market in turn will increase the growth of the banking industry in the next 5 years.
The digitalization of rural India, the penetration of internet in the rural areas have increased multifidly, The YoY growth increase of rural internet users is 8% , i.e. 333 million . Around 45% of data consumption in India is by the rural population. The ratio of rural to urban internet subscribers is 7:10. Thus, the internet banking system will be accessed by the Indian population for 24*7 .
The increase in smartphone usage in India with India being the second in highest number of smartphone users and largest in internet users. Thus, the number of mobile banking users will considerably increase.
Almost 93% of digital payments are made through mobile. Thus, there will be an increase in mobile banking, internet banking, and usage of digital products and solutions.
Nifty PSU Bank Stocks
Nifty PSU Bank Index reflects the performance of the PSU Banks in India. This index constitutes of 12 public sector banks that are listed & traded and not listed but allowed to trade in the National Stock Exchange. Nifty PSU Bank helps in portfolio fund benchmarking, launching of ETFs, index funds and structured products. Nifty PSU Bank was launched by NSE on 30th August,2007 with base date as 1st January, 2004 and base value 1000. The Nifty PSU Bank is rebalanced and reconstituted on a half yearly basis.
|
Company Name |
Weightage |
|
State Bank of India |
34.24% |
|
Bank of Baroda |
15.16% |
|
Canara Bank |
12.18% |
|
Punjab National Bank |
11.83% |
|
Union Bank of India |
9.40% |
|
Indian Bank |
6.11% |
|
Bank of India |
4.86% |
|
Bank of Maharashtra |
2.10% |
|
Indian Overseas Bank |
1.60% |
|
Central Bank of India |
1.21% |
Performance Comparison of Nifty PSU Banks with all the other Sector Indices for a period of 1 year in NSE
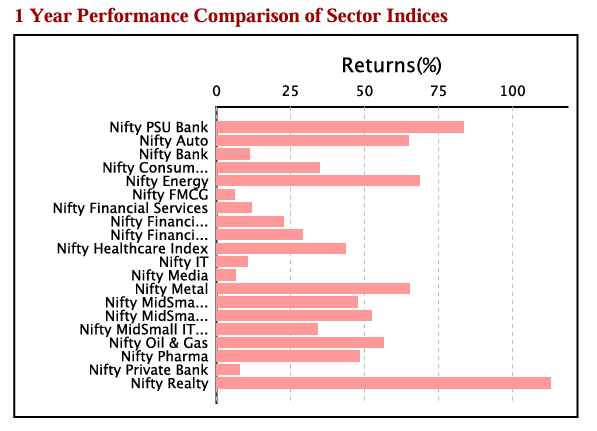
Source : niftyindices.com
Nifty PSU Bank stocks have delivered a total price return of 84.66% for a period of 1 year. The total return since inception is 11.92%. The total price return on quarter to date was 6.02% and year to date was 30.03%.
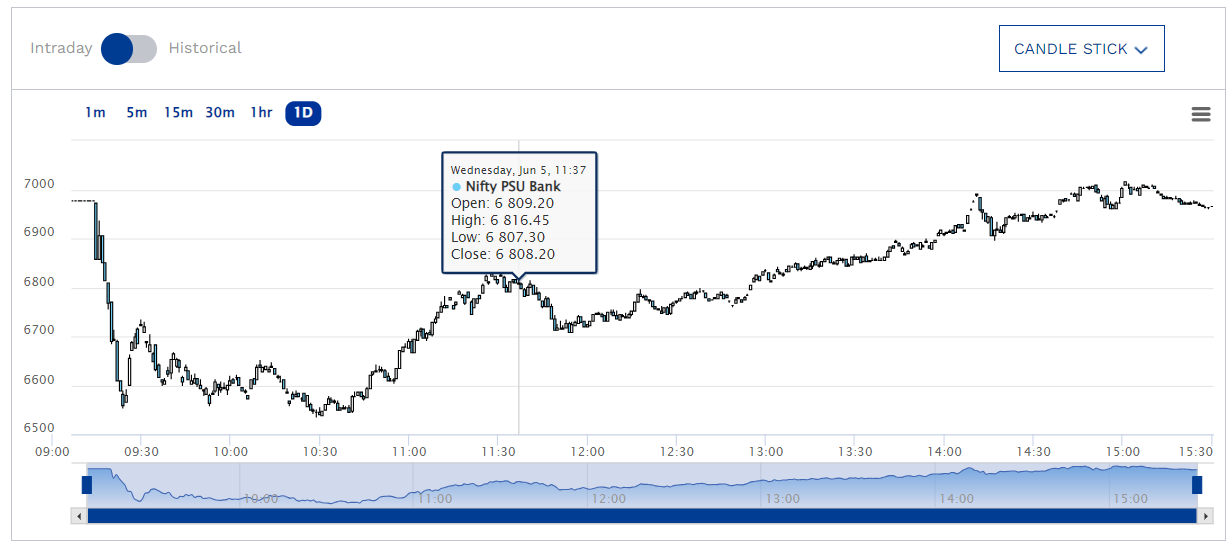
Historical Price Analysis of Nifty PSU Bank for a period of 1 year

The price to equity ratio is 9.6 and price to book ratio is 1.71. Nifty PSU Bank index has delivered a dividend yield of 1.55%.
Eligibility Criteria for Nifty PSU Bank Constituent Stock
It constitutes of stock from public sector banks in India that has a ranking within top 800 on the basis of average daily turnover and average daily full market capitalization in the past six months.
The company's outstanding share capital which is held by the Central and/ or state government should be a minimum of 51%.
In the past six months, the company's trading frequency should be a minimum of 90%.
The companies should have been listed for a period of at least one month as on the cutoff date.
Each index constituent stock should weigh not more than 33% and the top three index constituent stock should cumulatively not weigh more than 62% at time of rebalancing.
Nifty PSU Bank Stock Comparison
To analyze the Nifty PSU Bank stocks, let’s consider three of the Nifty PSU Bank Stocks for comparative analysis.
Step into the future of investing with Enrich Money! Unlock your financial potential with a free demat trading account from Enrich Money, the premier wealth tech management company
Let’s consider the below stocks for comparative analysis.
-
State Bank of India
-
Bank of Baroda
-
Canara Bank
Intraday Price Comparative Analysis
|
Stock Name (as of 6th June, 2024) |
State Bank of India |
Bank of Baroda |
Canara Bank |
|
Open (INR) |
Rs.800 |
Rs. 262.60 |
Rs.117.60 |
|
High (INR) |
Rs.833.35 |
Rs.274 |
Rs.120.60 |
|
Low (INR) |
Rs.796 |
Rs.261.45 |
Rs.116.50 |
|
Last Traded Price (INR) |
Rs.816.95 |
Rs.268.90 |
Rs.118 |
|
Price Change (INR) |
-Rs.16.4 |
-Rs.5.1 |
-Rs.2.6 |
|
Price Change (%) |
-2% |
-1.89% |
-2.2% |
|
Previous Close (INR) |
Rs.789.75 |
Rs.260 |
Rs.115.20 |
Based on the intraday price analysis, all the above Nifty PSU Bank stocks are traded in the same price change.
Monthly Price Comparative Analysis
|
Stock Name |
State Bank of India |
Bank of Baroda |
Canara Bank |
|
Date |
Closing Price in INR |
||
|
Jun 6, 2024 |
817.25 |
268.6 |
117.8 |
|
Jun 1, 2024 |
789.75 |
260 |
115.2 |
|
May 1, 2024 |
830.35 |
264.9 |
118 |
|
Apr 1, 2024 |
826.25 |
281.5 |
124.39 |
|
Mar 1, 2024 |
752.35 |
264.05 |
116.21 |
|
Feb 1, 2024 |
748.1 |
265.45 |
112.89 |
|
Jan 1, 2024 |
640.5 |
247.6 |
96.4 |
|
Dec 1, 2023 |
642.05 |
231.1 |
87.5 |
|
Nov 1, 2023 |
564.75 |
197.1 |
80.61 |
|
Oct 1, 2023 |
565.55 |
196.2 |
76.87 |
|
Sep 1, 2023 |
598.55 |
213.95 |
75.25 |
|
Aug 1, 2023 |
561.35 |
187.15 |
64.08 |
|
Jul 1, 2023 |
620.2 |
202.2 |
68.87 |
The stock prices of State Bank of India, Bank of Baroda and Canara Bank are in uptrend for the past one year. The stock price of State Bank of India has gained by 31.77% , Bank of Baroda has gained by 32.84% and Canara Bank by 71.05%.
Chart Analysis
State Bank of India
SBI Bank, a public sector entity, ranks among the largest banks in India. It operates in the business of personal banking, corporate banking and merchant banking. The company has a customer base of 46.77 crores , with around 227 global servicing offices, 22266 bank branches, 65030 ATMs etc…
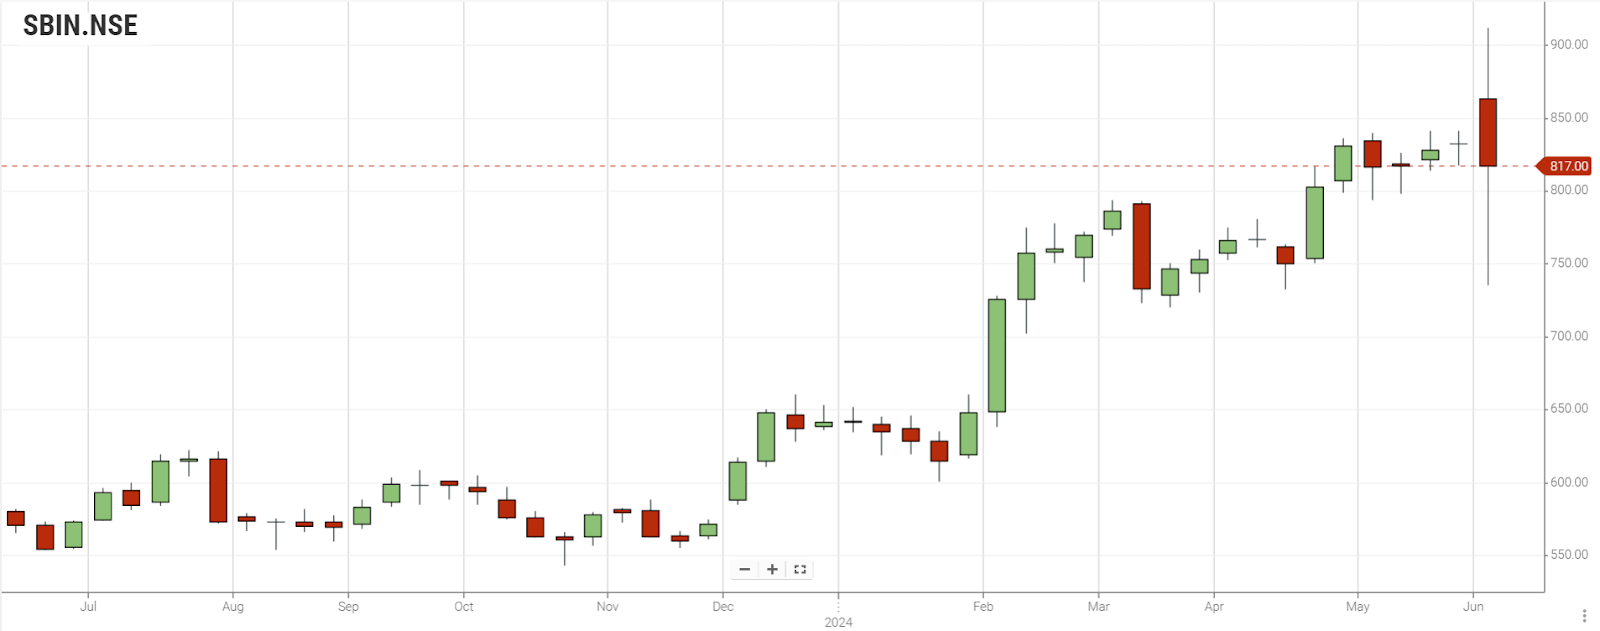
Bearish Initiation Heikin Ashi pattern is formed on SBI Bank daily charts. Candlestick with bearish engulfing pattern is formed with weak volume signals indicating a bad signal.
Bank of Baroda
BOB Bank , operating in the business of retail and corporate banking business. The bank has a stable presence in India with 8246 branches, 11553 ATMs. The bank has remarkable global presence with 99 subsidiaries across 21 countries. The company’s subsidiaries are BOB Financial Solutions Limited and BOB Capital Markets .The bank has 98.57% ownership rights in Nainital Bank. BOB Bank is also the sponsor for Uttar Pradesh Gramin Bank, Baroda Rajasthan Gramin Bank and Baroda Gujarat Gramin Bank.
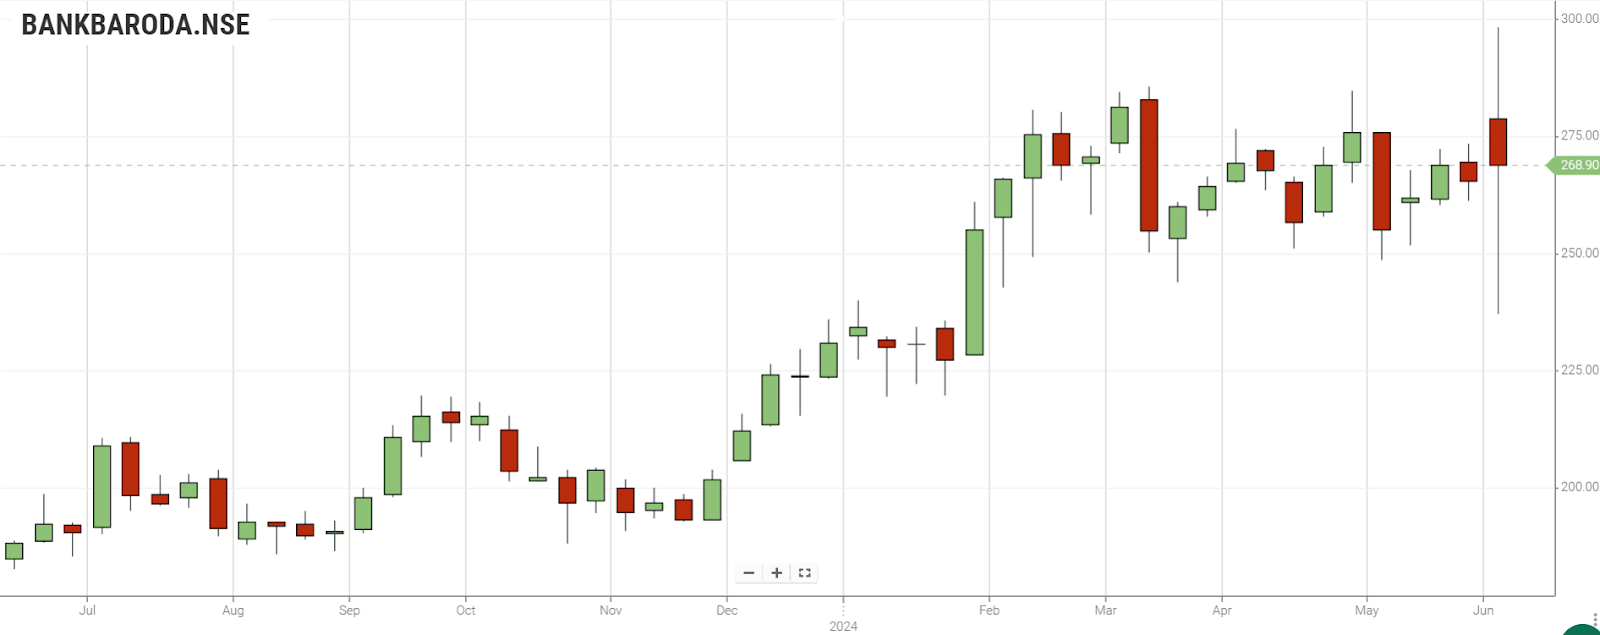
Bearish Initiation Heikin Ashi pattern is formed on BOB Bank daily charts. Bullish Heikin Ashi Pattern with high volume is formed on monthly price charts.
Canara Bank
The third-largest public sector bank, headquartered in Mangalore, merged with Syndicate Bank in 2020. The bank operates in the business of personal and corporate banking with 9722 branches, 3 international branches, servicing over 10.4 crores customers.
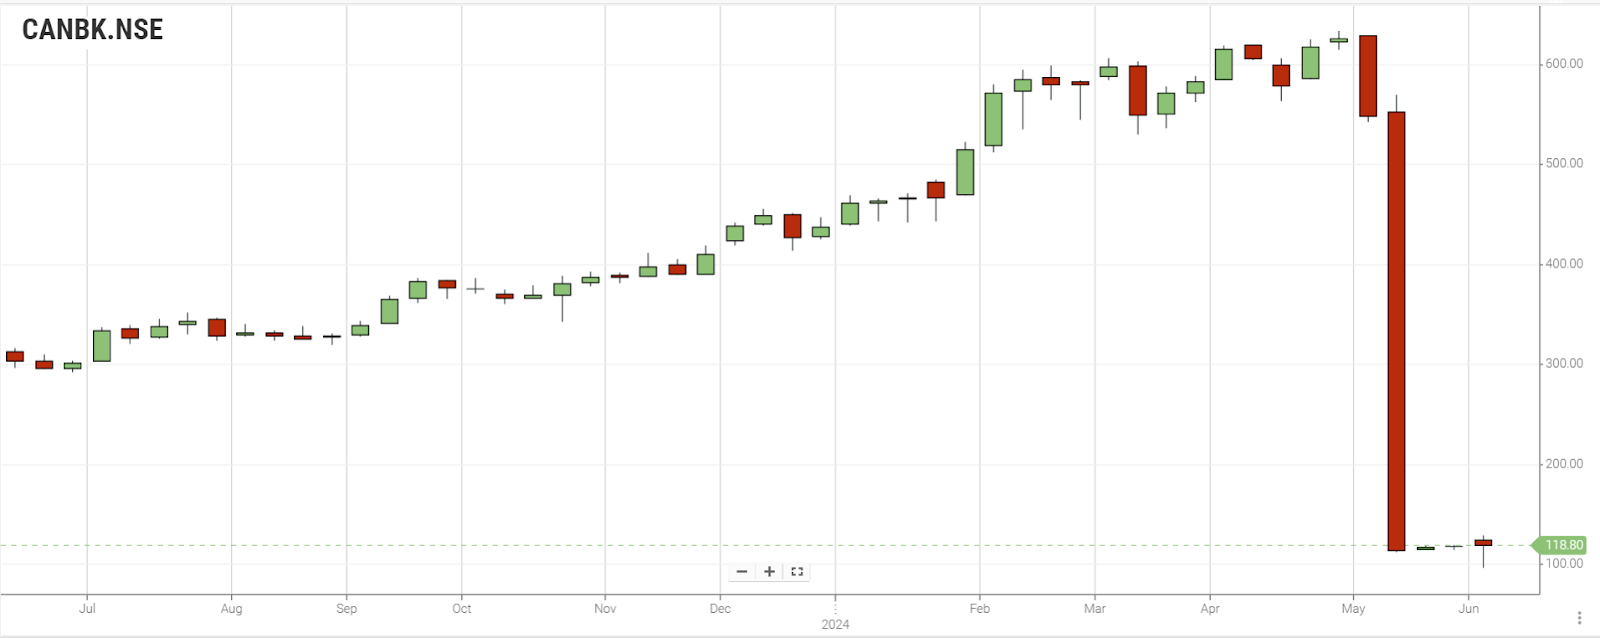
A bullish initiation Heikin Ashi pattern has emerged on the daily price charts. On monthly price data charts, Bullish Heikin Ashi pattern with high volume is formed.
Fundamental Analysis
|
Stock Name |
State Bank of India |
Bank of Baroda |
Canara Bank |
|
Market Cap (in INR Crores) |
729096 |
138980 |
107079 |
|
Dividend Yield % |
1.68 |
2.83 |
2.73% |
|
TTM EPS (in INR) |
75.19 |
36.29 |
16.83 |
|
TTM PE Ratio |
10.87 |
7.41 |
7.01 |
|
Industry P/E |
17.64 |
17.64 |
17.64 |
|
P/B |
1.88 |
1.16 |
1.29 |
|
ROE % |
16.42 |
15.38 |
16.04 |
|
ROCE % |
1.37 |
1.5 |
1.56 |
State Bank of India
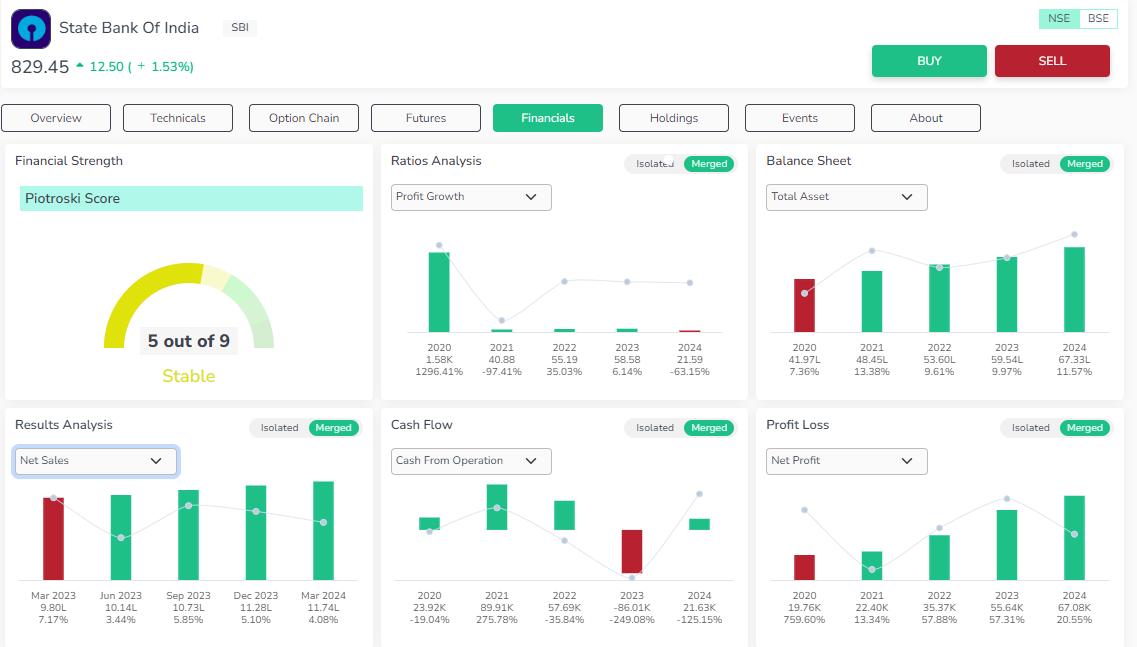
Valuation – The stock is undervalued. But the stock price indicates that it's very costly with its book value decreasing for the past three years.
Profitability -The stock has given excellent yield . Over the past three years, there has been an increase in the EPS value, ROE, net margin, and net profit. But the RoA for the past three years is down.
Growth – The company’s numbers in terms of net sales, annual sales and quarterly sales are increasing along with a stable increase in total assets in the last three years.
Stability - The stock has poor maintenance of debt-to-equity ratio for the past three years. Also, the company has negative liquidity.
Bank of Baroda
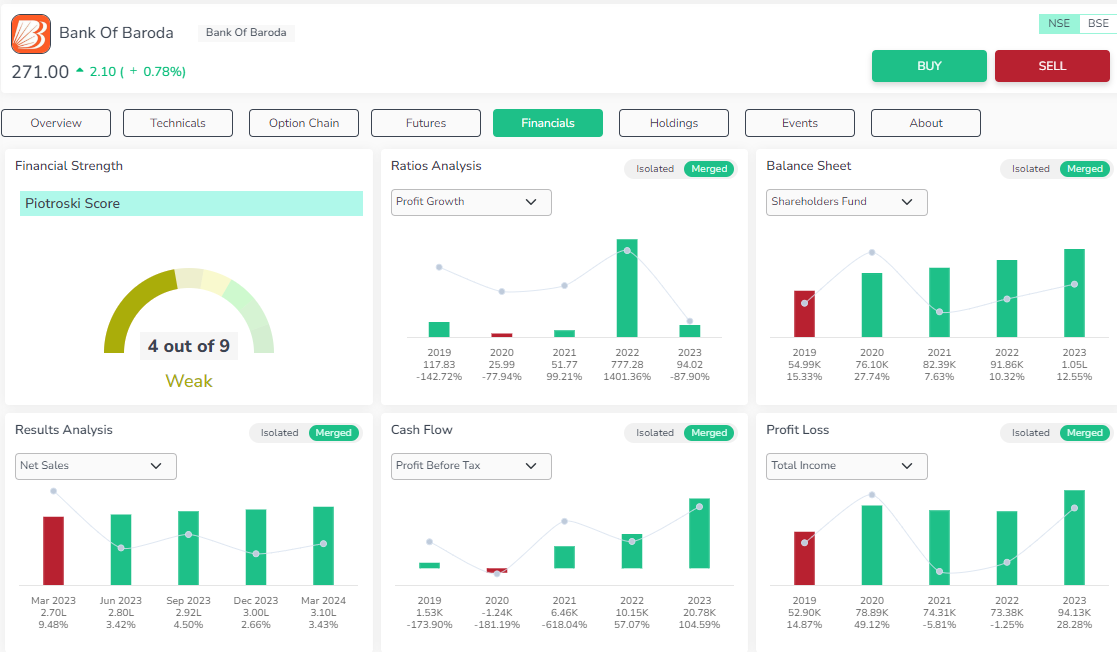
Valuation - The stock is undervalued. The book value of the stock has been in downtrend in the last three years.
Profitability - The stock has given good earnings yield . Over the past three years, the EPS value, ROE, net margin, and net profit have all shown significant growth. But the RoA for the past three years is very low.
Growth - The company’s numbers in terms of net sales, annual sales and quarterly sales are increasing along with a stable increase in total assets in the last three years.
Stability – The stock has reduced its debt in the past five years with increase in revenue. But the stock has not maintained good liquidity to meet interest needs.
Canara Bank
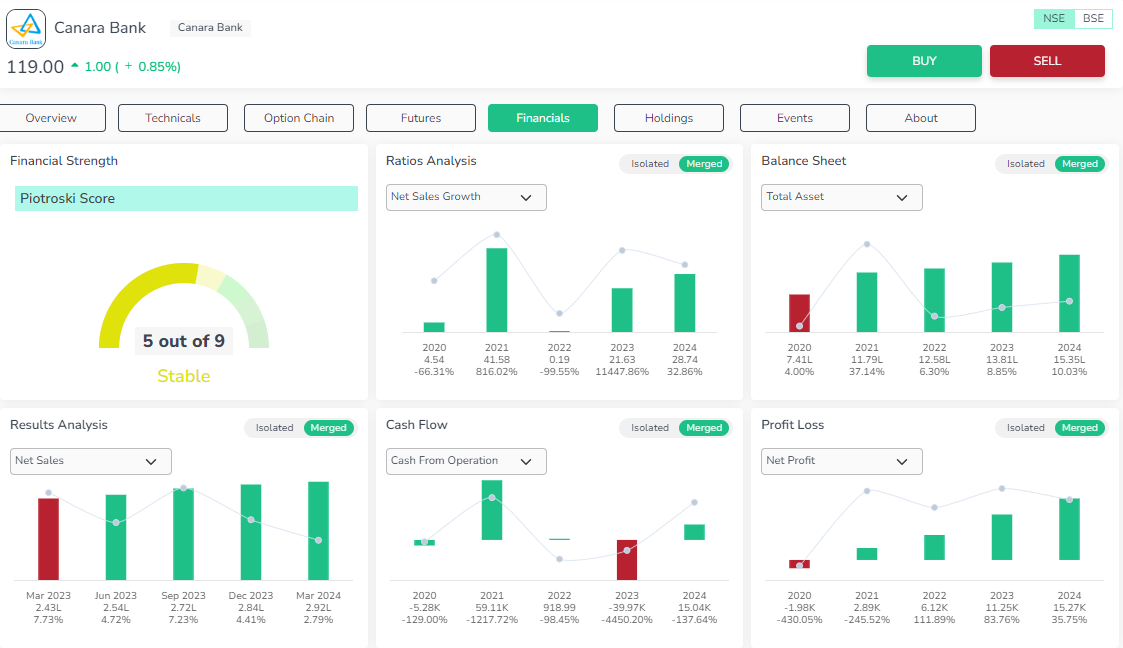
Valuation - The stock is undervalued. But the book value of the stock has decreased in the past three years.
Profitability - The stock has given good earnings yield Over the past three years, there has been an increase in the EPS value, ROE, net margin, and net profit. But the RoA for the past three years is very low.
Growth - The company’s numbers in terms of net sales, annual sales and quarterly sales are increasing along with a stable increase in total assets in the last three years.
Stability - The stock has reduced its debt in the past five. The stock has maintained good liquidity to meet interest needs.
Technical Analysis
To understand a stock’s performance, detailed insights on a stock's fundamentals and technicalities is crucial. Sign into the Orca app.
|
Technical Analysis @ 07.06.2024 |
|||
|
Stock Name |
State Bank of India |
Bank of Baroda |
Canara Bank |
|
Moving Averages |
|||
|
SMA 20 Days |
805.28 |
266.2 |
569.07 |
|
EMA 20 Days |
804.33 |
264.73 |
539.79 |
|
SMA 200 Days |
654.8 |
228.15 |
454.06 |
|
EMA 200 Days |
680.53 |
233.72 |
472.42 |
|
Indicators |
|||
|
RSI |
58.88 |
49.16 |
9.11 |
|
CCI |
64.9 |
-18.74 |
-583.35 |
|
WILLIAMS_R |
-37.89 |
-57.58 |
-99.43 |
|
UO |
47.19 |
42.65 |
12.78 |
|
Rate of Change |
-1.17 |
-5.6 |
-81.06 |
|
MACD |
13.72 |
-1.13 |
-44.12 |
|
ADX |
0 |
0 |
|
|
Standard Pivot Levels |
|||
|
R4 |
824.6 |
264.9 |
119.8 |
|
R3 |
823.4 |
264.6 |
119.6 |
|
R2 |
822.2 |
264.3 |
119.4 |
|
R1 |
821.45 |
264.1 |
119.25 |
|
Pivot |
820.25 |
263.8 |
119.05 |
|
S1 |
819.5 |
263.6 |
118.9 |
|
S2 |
-819.8 |
-263.7 |
-119 |
|
S3 |
817.55 |
263.1 |
118.55 |
|
S4 |
816.8 |
262.9 |
118.4 |
State Bank of India
SMA and EMA levels indicate that stock exhibits bearish signals. The technical indicators imply that the stocks would follow a neutral to bullish signals.
Bank of Baroda
SMA and EMA levels indicate that stock exhibits bearish signals. The technical indicators imply that the stocks would be neutral.
Canara Bank
SMA and EMA levels indicate that stock exhibits bullish signals. The technical indicators imply that the stocks would follow a neutral to bearish pattern.
The below chart exhibits the comparative technical study of three Nifty PSU Bank stocks based on Moving average crossover signals and Relative strength index for a period of 6 months.
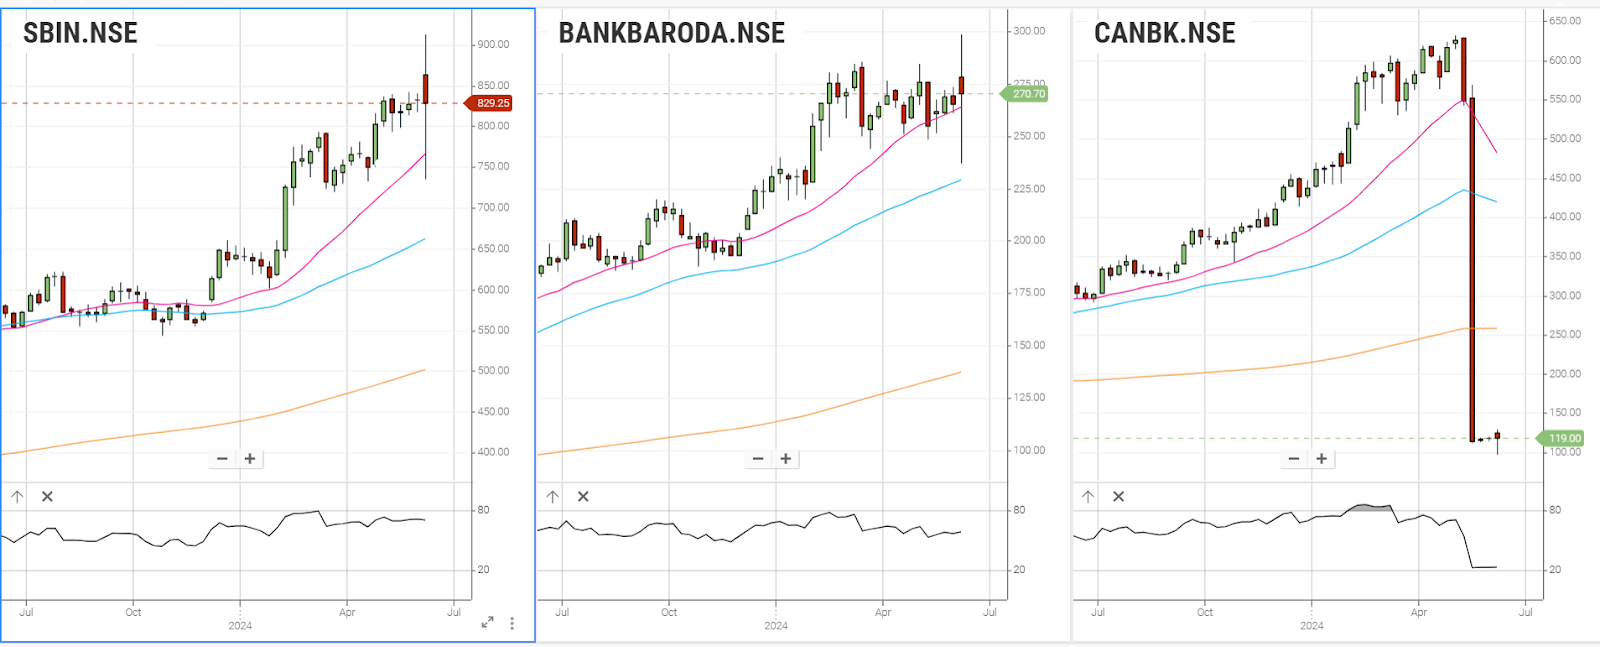
State Bank of India is displaying robust bullish signals across short, medium, and long-term outlooks.
Bank of Baroda exhibits strong bullish signals from short , medium and long term.
Canara Bank exhibits bearish signals from short to medium term and bullish signal on long term.
Conclusion
The Nifty PSU Bank Index, reflecting the performance of major public sector banks in India, demonstrates the robust and well-capitalized nature of the Indian banking industry. With over 123,000 bank branches and 252,000 ATMs, the industry is bolstered by USD 2 trillion in deposits, low non-performing assets, and stringent capital adequacy measures. Government initiatives have enhanced accessibility and digitalization, contributing to an optimistic outlook for the banking sector. As India's consumer economy is poised to grow significantly, particularly with a young and tech-savvy population, the demand for banking services is set to rise. Enrich Money offers valuable resources and a free demat trading account, providing a gateway to investment opportunities in this promising sector.
Frequently Asked Questions
What is the Nifty PSU Bank Index?
The Nifty PSU Bank Index is a benchmark index that tracks the performance of public sector banks listed on the National Stock Exchange (NSE) of India. It includes major government-owned banks and provides an indicator of their market performance.
Which banks are included in the Nifty PSU Bank Index?
The Nifty PSU Bank Index comprises major public sector banks such as State Bank of India (SBI), Punjab National Bank (PNB), Bank of Baroda (BoB), Canara Bank, and Union Bank of India, among others. The composition may change based on the performance and criteria set by NSE.
How is the Nifty PSU Bank Index calculated?
The Nifty PSU Bank Index is calculated using the free-float market capitalization methodology. This means the index value is derived based on the market capitalization of its constituent stocks, adjusted for the free-float factor, which excludes promoter holdings and other restricted shares.
How can I invest in the Nifty PSU Bank Index?
Investors can invest in the Nifty PSU Bank Index through exchange-traded funds (ETFs) that track the index, mutual funds, or by directly purchasing shares of the constituent banks. It's advisable to conduct thorough research or consult with a financial advisor like Enrich Money before investing.
What are the risks associated with Nifty PSU Bank ?
Investing in Nifty PSU Bank stocks poses risks such as regulatory changes, economic downturns affecting loan quality, and industry competition impacting profitability.
Related Resource
Disclaimer: This blog is dedicated exclusively for educational purposes. Please note that the securities and investments mentioned here are provided for informative purposes only and should not be construed as recommendations. Kindly ensure thorough research prior to making any investment decisions. Participation in the securities market carries inherent risks, and it's important to carefully review all associated documents before committing to investments. Please be aware that the attainment of investment objectives is not guaranteed. It's important to note that the past performance of securities and instruments does not reliably predict future performance.
